.webp)
Summarize this documentation using AI
Key Takeaways
- This is the Q3 2026 update to our State of B2C Retention series. It is built entirely on published, citable data, with every figure attributed, so you can audit it rather than trust it.
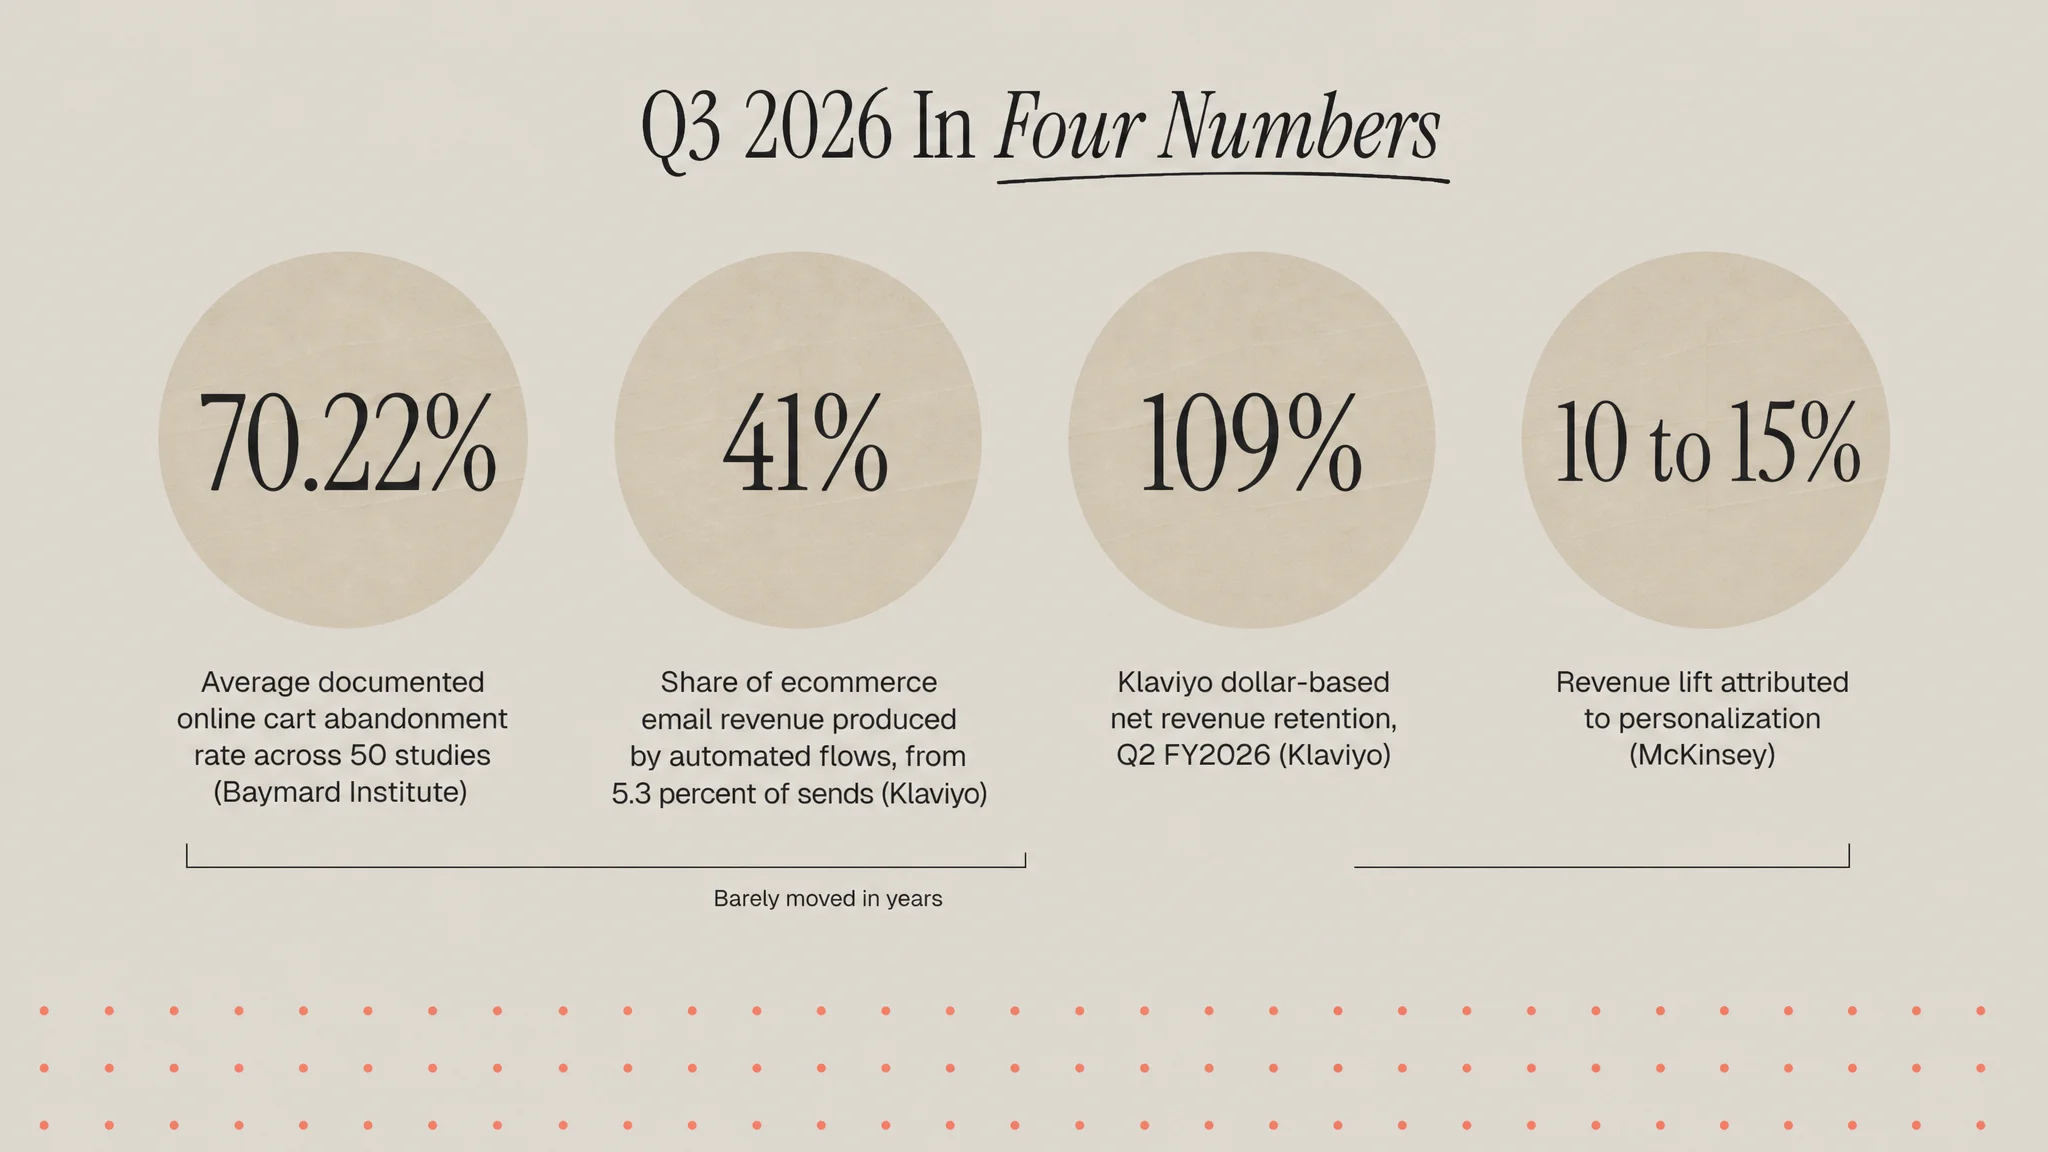
- The headline finding: retention infrastructure spending is compounding at 26% or more a year while the underlying consumer behaviour metrics have barely moved. Cart abandonment still sits at 70.22%.
- Automated flows remain the single largest unexploited margin in B2C email. Klaviyo data across more than 183,000 customers shows flows produce nearly 41% of email revenue from 5.3% of sends.
- Net revenue retention at the two largest lifecycle platforms landed at 109% and 110%, with larger programs expanding faster than smaller ones. Program maturity, not platform choice, is the differentiator.
- Q4 priority for most brands: fix the flow mix before buying anything new. The published benchmarks say the return is already sitting inside the tool you own.
In Q2 we published the first State of B2C Retention report. This is the Q3 update, and the honest headline is that the market moved less than the noise around it suggests.
A note on method before the numbers, because it changes how you should read them. Everything here is drawn from published sources: audited quarterly filings, vendor benchmark studies with disclosed sample sizes, and institutional research. Every figure carries a link. Where we could not source a number, we left it out rather than estimating it. Retention reporting has a credibility problem precisely because so much of it is composed of unattributed round numbers, and a data report that cannot be checked is marketing with a chart on it.
Finding 1: the infrastructure layer is growing faster than the behaviour it manages
Three of the companies that carry B2C lifecycle workloads reported between August 5 and September 8, 2026, and the growth band was tight.
Klaviyo posted Q2 fiscal 2026 revenue of $370.6 million, up 26%, with more than 205,000 customers and 4,477 accounts above $50,000 ARR, a 36% increase. Full year guidance was raised to $1.526 billion to $1.534 billion (Klaviyo). Braze posted fiscal Q2 2027 revenue of $227.2 million, up 26.2%, with 2,789 customers and 361 above $500,000 ARR (Braze). Shopify reported more than 30% growth simultaneously across GMV, revenue, gross profit and free cash flow, with revenue up 34% (Shopify).
Now set that against the consumer side. The average documented cart abandonment rate across 50 studies compiled by the Baymard Institute is 70.22% (Baymard Institute). That figure has been remarkably stable across two decades of tooling improvement.
The conclusion is not that the tools do not work. It is that spending on retention infrastructure and achieving retention outcomes are two different projects, and only one of them is growing at 26% a year. If you want the structural version of this argument, beyond growth loops covers why B2C retention resists the playbooks imported from software.
Finding 2: net revenue retention clusters at 109% to 112%, and scale is the variable
Dollar-based net revenue retention is the nearest thing to a retention metric that appears in a public filing. It measures what happens to a cohort of existing customers over twelve months once churn, contraction and expansion have netted out.
Klaviyo reported 109%. Braze reported 110% across all customers and 112% among customers above $500,000 in ARR. The spread between Braze's overall figure and its enterprise cohort is the finding worth keeping: larger programs expand faster.
Two caveats keep this honest. First, both platforms price partly on usage, so a brand whose list grows contributes expansion revenue regardless of whether its own repeat rate improved. Second, these are vendor cohorts, not consumer cohorts. They describe the health of the spending, not the health of the loyalty. Use them as a market ceiling and measure your own curve properly. What is a retention curve covers the shape, and cohort LTV versus blended LTV covers why the blended version of this number lies to you.
What scale actually buys
Programs above the $500,000 ARR line are not buying better software. They are buying more channels, more journeys, more segments and, critically, dedicated lifecycle headcount. Expansion needs somewhere to go, and someone to build it. That is a staffing finding disguised as a platform finding, and it is consistent with what we see in engagements: the constraint is almost never the tool. The retention tech stack for $1M to $10M DTC brands maps the staffing and tooling by revenue stage.
Finding 3: the flow-versus-campaign gap is the largest documented margin in B2C email
This is the most actionable number in the whole report, and it comes from the largest disclosed sample we could find.
Klaviyo's 2026 benchmark analysis, drawn from more than 183,000 customers, reports that email flows generate nearly 41% of total email revenue from just 5.3% of sends. Revenue per recipient from flows runs nearly 18 times higher than from campaigns. Click rates are more than three times higher, 5.58% against 1.69%. Placed order rates run 13 times higher. Top decile flows reach revenue per recipient as high as $7.79 with click rates above 10%. And nearly 48% of flow-driven email revenue comes from new buyers, against just 16% for campaigns (Klaviyo 2026 email marketing benchmarks).
Read the first sentence again. Five per cent of the sending volume is doing forty per cent of the revenue work.
Most brands we audit have the inverse allocation of attention: the campaign calendar gets a weekly meeting, the flows get looked at when something breaks. The benchmark says the ratio should be reversed. If your flow library stops at a welcome series and an abandoned cart, the gap between you and the top decile is not a strategy problem, it is a build backlog. Start with the welcome series, then replenishment, win-back and sunset.
The finding inside the finding: flows acquire
One line in the Klaviyo set reframes the whole category. Nearly 48% of flow-driven email revenue comes from new buyers, against just 16% for campaigns.
Automation is filed under retention on almost every org chart and in almost every budget. The data says roughly half of what it produces is first purchases. A checkout abandonment flow is an acquisition mechanism running on retention infrastructure. A welcome series converts people who have expressed interest and not yet bought. Both get counted against the retention line and neither is doing retention work.
Two consequences follow. First, brands that justify lifecycle investment purely on repeat revenue are understating the return by something close to half, which makes the budget conversation harder than it needs to be. Second, when paid acquisition costs rise, the cheapest incremental acquisition channel most brands own is often a flow they have not built yet. That is an uncomfortable finding for anyone who has been treating the lifecycle team as a cost centre downstream of growth.
If this is new territory, what customer activation is covers the first-purchase mechanics and what triggered messaging is covers the delivery mechanism.
Finding 4: personalization economics have not changed, which is itself the news
McKinsey's analysis puts the revenue lift from personalization at 10% to 15%, varying between 5% and 25% by sector and execution quality. Fast-growing companies derive 40% more of their revenue from personalization than slower-growing peers. On the consumer side, 71% expect personalized interactions and 76% report frustration when they do not get them (McKinsey).
These numbers have been stable for several years. In a quarter where every vendor led with AI, the absence of movement in the personalization lift band is the finding. Klaviyo's own data offers one concrete AI datapoint: AI-powered recommendations lift email click rates to 3.75% on average and 8.79% for top performers. That is a real improvement on a real metric. It is also a click rate improvement, not a retention improvement, and the two are not the same claim.
We covered the distinction in AI-powered lifecycle marketing in 2026 and email personalization at scale for DTC.
Finding 5: the profit case for retention is older and better evidenced than the AI case
Fred Reichheld's work at Bain remains the cleanest statement of why any of this matters: "In financial services, for example, a 5% increase in customer retention produces more than a 25% increase in profit" (Bain & Company).
Note what the original says and what the internet has done to it. The widely circulated "25% to 95%" range compresses several findings across sectors into one quotable band. The sourced claim is narrower and sector-specific. We are using the narrower one, because a retention report that inflates its own central statistic has no business criticising anyone else's data hygiene.
The operational translation is unglamorous: a five point improvement in retention is worth more to most consumer P&Ls than a five point improvement in conversion, and it is usually cheaper to buy. Customer acquisition cost versus LTV works the arithmetic.
What we could not source, and why we are saying so
Three things we wanted for this update and did not include.
First, a like-for-like quarter over quarter delta on repeat purchase rate across verticals. The public benchmark sets are refreshed annually, not quarterly, so a Q2 to Q3 comparison would have been manufactured. Second, an SMS revenue attribution benchmark with a disclosed sample size comparable to Klaviyo's email set. The SMS numbers in circulation are mostly vendor marketing without published methodology. Third, any credible measurement of AI agent impact on retention outcomes as opposed to build velocity. Nobody has published it yet, including the vendors with the most incentive to.
Those gaps are the roadmap for the Q4 update.
How to reproduce this report for your own brand
A market report is only useful if it gives you a comparison. Here is the internal version, which takes about a day and produces numbers you can defend in a board meeting.
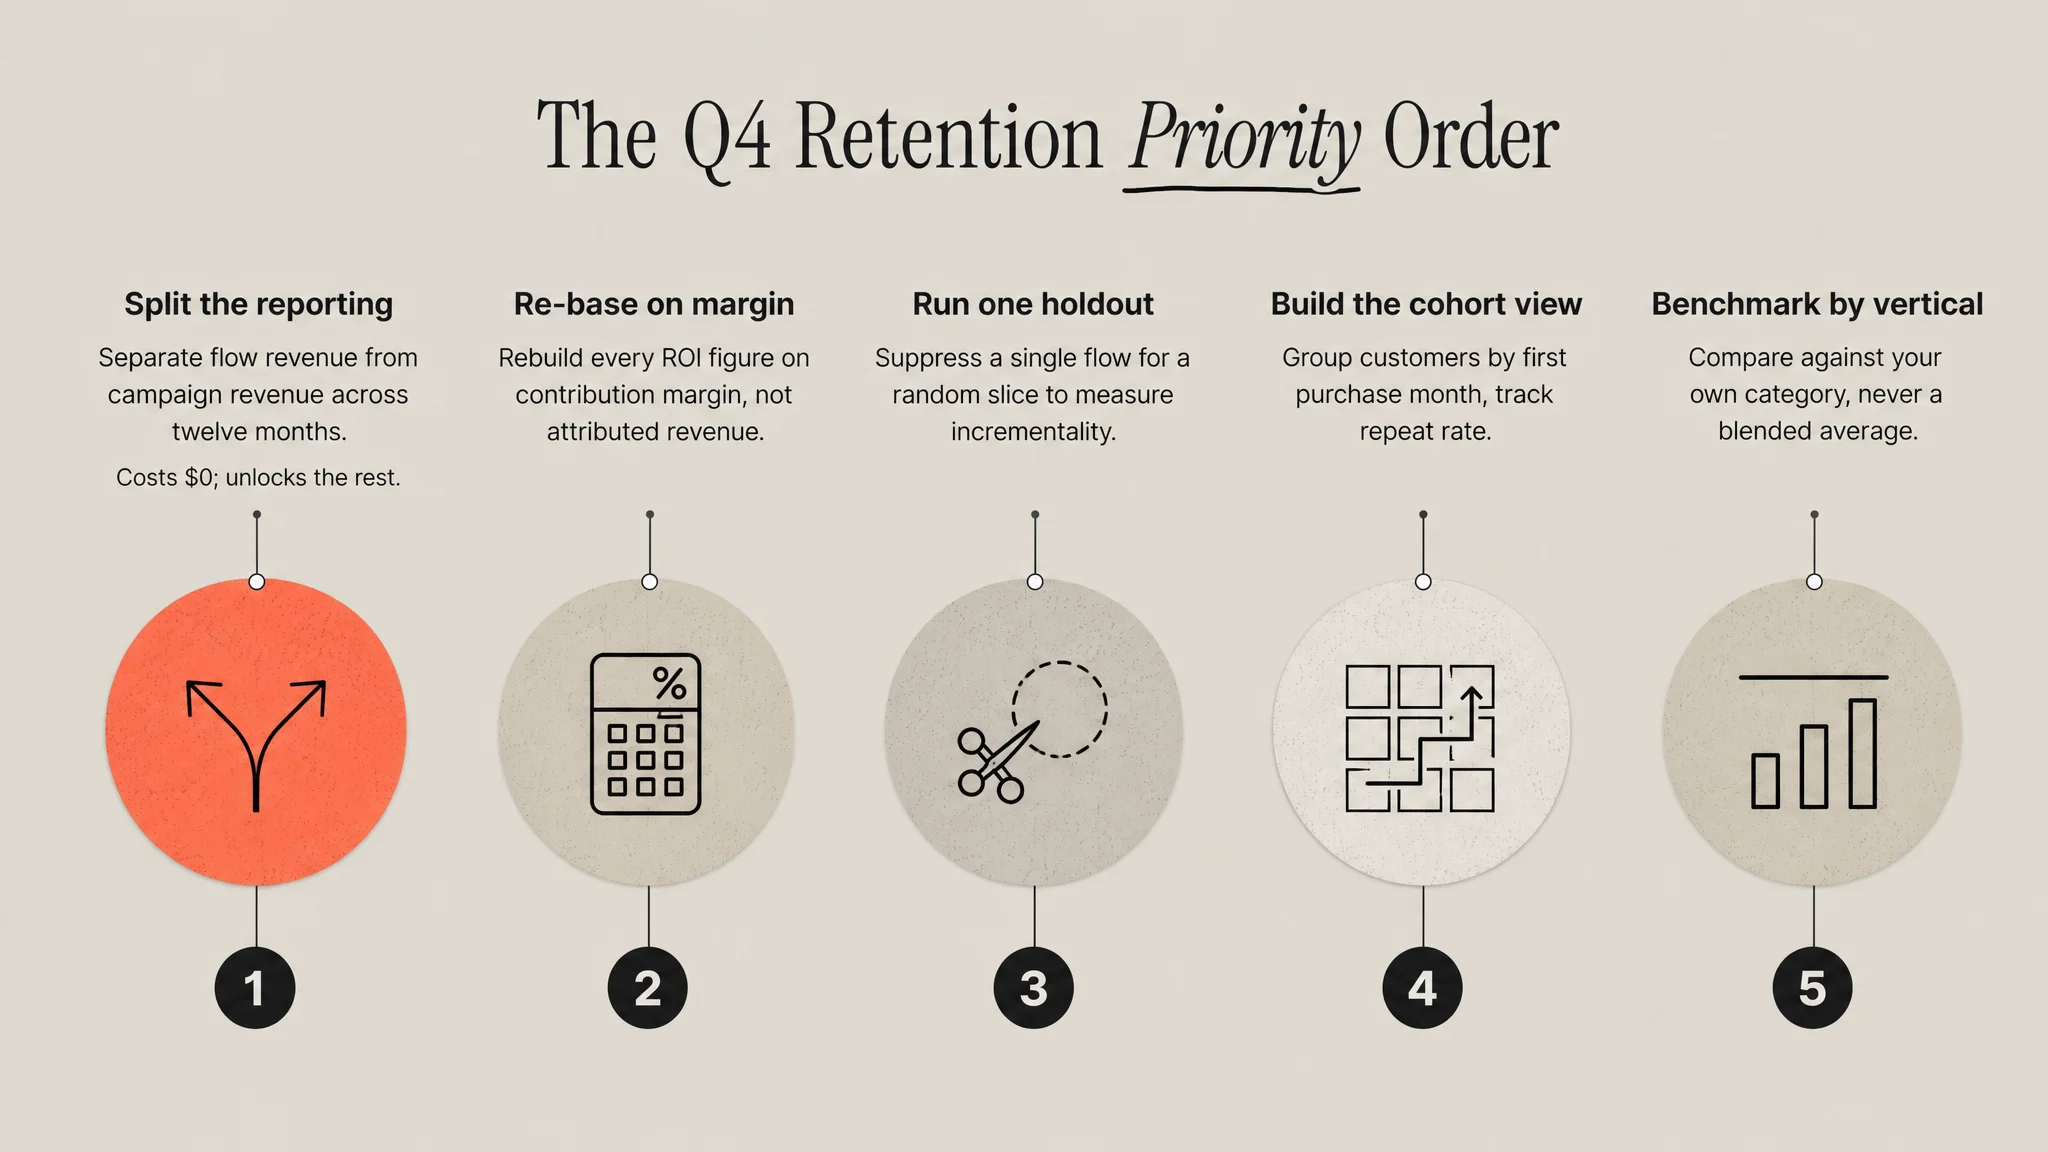
Step 1: split flow revenue from campaign revenue
Twelve months, monthly granularity, revenue and send volume for each. You are looking for your own version of the 5.3% and 41% figures. Most reporting defaults blend them, so this usually needs a deliberate export rather than a dashboard screenshot.
Step 2: rebuild the numbers on contribution margin
Apply gross margin, then subtract discount cost, shipping subsidy and expected returns. Revenue-based ROI numbers are the main reason lifecycle programs look better on a slide than in the P&L.
Step 3: run one holdout
Pick the flow you believe in most and suppress it for a random slice of eligible recipients for a full purchase cycle. The difference in conversion is your incrementality estimate. Without this, every number above is attribution, not causation.
Step 4: build the cohort view
Group customers by first-purchase month and track repeat rate by month since acquisition. This is the only view that shows whether retention is genuinely improving or whether a good quarter of acquisition is flattering the blended average. What is a retention curve has the construction.
Step 5: compare against your vertical, not the market
A 25% repeat rate is strong in one category and weak in another. Use retention benchmarks by vertical for 2026 rather than a blended figure.
Step 6: write down what you could not measure
Every honest internal report has gaps. Naming them is what stops next quarter's version quietly inventing them.
What to do in Q4
Audit the flow mix before buying anything
Pull the split between flow revenue and campaign revenue for the last twelve months. If flows are producing materially less than 40% of email revenue, the gap to the benchmark is your Q4 project, and it does not require new software. How to audit your lifecycle marketing program is the checklist.
Reconcile platform spend against repeat rate
Twelve months of invoices against twelve months of second-order rate. If the invoice grew faster, you funded someone else's net revenue retention.
Benchmark against your vertical
Blended market averages are close to useless at the category level. Use the B2C retention benchmarks database and retention rate benchmarks for ecommerce in 2026.
Put a number on every AI claim before you sign
Which metric, how much, measured how, over what window. Build velocity is a legitimate answer. Retention is a claim that needs cohort evidence attached.
The bottom line
Q3 2026 data describes a market where the infrastructure is compounding at 26% or better and consumer behaviour is close to flat. Cart abandonment at 70.22%. Personalization lift still 10% to 15%. Net revenue retention at the platform layer clustered between 109% and 112%, with scale rather than software as the differentiator.
Against that backdrop the single largest documented opportunity in B2C email is not a new capability at all. It is a mix problem: 5.3% of sends producing 41% of revenue, in a market where most brands still allocate their attention to the other 94.7%. That is the Q4 project, and the benchmark data says it is already paid for.
Sources
- Klaviyo Investor Relations, Q2 2026 results, August 5, 2026
- Braze Reports Strong Fiscal Second Quarter 2027 Results, September 8, 2026
- Shopify Q2 2026 Financial Results, August 5, 2026
- Klaviyo, 2026 Email Marketing Benchmarks by Industry
- Baymard Institute, Cart Abandonment Rate Statistics
- McKinsey, The value of getting personalization right or wrong is multiplying
- Fred Reichheld, Bain & Company, Prescription for cutting costs
Frequently Asked Questions
What is the State of B2C Retention Q3 2026 update?
It is the quarterly refresh of Propel's retention data report, covering the third quarter of 2026. Every figure is drawn from a published, citable source: audited quarterly filings from Klaviyo, Braze and Shopify, vendor benchmark studies with disclosed sample sizes, and institutional research from Baymard, McKinsey and Bain. Where a number could not be sourced, it was left out rather than estimated, and the gaps are named in the report.
What percentage of ecommerce email revenue comes from automated flows?
Klaviyo's 2026 benchmark analysis, drawn from more than 183,000 customers, reports that automated email flows generate nearly 41 percent of total email revenue from just 5.3 percent of sends. Revenue per recipient from flows runs nearly 18 times higher than from campaigns, click rates are 5.58 percent against 1.69 percent, and placed order rates are 13 times higher. That mix gap is the largest documented margin available in B2C email.
Has cart abandonment improved in 2026?
No. The Baymard Institute puts the average documented online shopping cart abandonment rate at 70.22 percent, derived from 50 separate studies spanning 2006 to 2025. The figure has been notably stable across two decades of tooling improvement. That stability is the central tension in the Q3 data: retention infrastructure spending is compounding at 26 percent or more a year while the underlying consumer behaviour has barely moved.
Do automated flows only drive repeat purchases?
No, and this is the most overlooked finding in the 2026 data. Klaviyo reports that nearly 48 percent of flow-driven email revenue comes from new buyers, against just 16 percent for campaigns. Checkout abandonment and welcome flows are acquisition mechanisms running on retention infrastructure. Brands that justify lifecycle investment purely on repeat revenue are therefore understating the return by close to half.
How much profit does a 5 percent increase in retention generate?
Fred Reichheld's research at Bain and Company states that in financial services, a 5 percent increase in customer retention produces more than a 25 percent increase in profit. The widely circulated 25 to 95 percent range compresses several sector findings into one quotable band, so the narrower sourced claim is the one worth using. The practical implication is that a five point retention gain usually beats a five point conversion gain and costs less to buy.