Summarize this documentation using AI
Key Takeaways
- Across ecommerce, roughly 28% to 30% of customers ever place a second order. Metrilo puts it at 28.2% across 65 DTC businesses, and Decile's benchmarking data puts the all-brand average at 30%.
- The spread by category is wider than the average is useful: from about 20.9% (tea) to 36.2% (CBD) repeat purchase rate, with time between orders running from 41 days to 148 days.
- Business model beats category. Chewy took 83.3% of FY2025 net sales through Autoship, and Recharge reports subscribers place nearly 3x more orders than one-time shoppers.
- Almost every "2026 ecommerce retention benchmark" page is recycling 2023 data. The primary sources are Decile's 2023 guide and Metrilo's undated dataset. We label the vintage on every number below.
- Benchmark against your own trailing cohorts first. A single blended retention rate hides the only thing worth managing, which is whether each new cohort is better than the last.
Every ecommerce operator eventually asks the same question: is our retention rate any good? It is a reasonable question with an unreasonably messy answer, because the benchmark you find on page one of Google is usually a number of unknown vintage, from an unknown sample, computed with an undisclosed formula.
So this article does two things. It gives you the best verified ecommerce retention benchmarks available, with the source and the date attached to each one. And it tells you plainly where the data is thin, because knowing that a benchmark is three years old and drawn from 65 self-selected brands changes how much weight you should put on it.
What is the average ecommerce retention rate in 2026?
Two primary datasets carry most of the weight here, and they agree more than you would expect.
Metrilo's analysis of 65 direct-to-consumer businesses found an overall retention rate of 28.2%, defined as the share of customers who placed more than one order. The same report found that "almost 60% of revenue comes from old customers," which is the number that actually matters to a P&L.
Decile's benchmarking guide put the average retention rate across all the brands in its dataset at 30%, measured over a 12 month window. That is the figure Shopify cites and it is the origin of most of the "average ecommerce retention rate" numbers circulating online.
So: somewhere close to 3 in 10 customers come back. Which means 7 in 10 do not, and that the majority of your revenue is being generated by a minority of your buyers. If you want the cross-industry view beyond ecommerce, our retention benchmarks by vertical breakdown covers subscription, telehealth, fintech, apps and marketplaces alongside DTC.
A necessary warning about the date on these numbers
Decile's figures are from 2023. Metrilo's report does not state a data period at all. We went looking for a genuinely 2026-dated, large-sample ecommerce retention benchmark broken out by category, and it does not appear to exist from any source that holds its own data.
What does exist, in abundance, is pages titled "2026 ecommerce retention benchmarks" that are aggregating those same two datasets without saying so. Several of the most prominent ones cite each other in a loop. Before you quote a retention benchmark in a board deck, click through to whoever supposedly measured it. If the trail does not end at a company with a dataset, the number is decoration.
Ecommerce retention benchmarks by sub-vertical
The average is the least interesting number in this article. What a coffee brand should expect and what a CBD brand should expect are not the same thing, and the gap is large enough to change strategy.
Decile's 2023 guide is the cleanest primary source for a side-by-side view, because it reports retention rate, repurchase rate and purchase frequency on the same basis:
| Category | 12-month retention rate | Repurchase rate | Purchase frequency |
|---|---|---|---|
| Food and beverage | 23% | 34% | 2.30 |
| Health and beauty | 21% | 35% | 2.20 |
| Fashion and apparel | 19% | 30% | 1.60 |
| Home goods | 12% | 20% | 1.30 |
Source: Decile 2023 Benchmarking Guide. Data period: 2023.
Metrilo's dataset goes narrower on category and gives a repeat purchase rate range that is worth internalising:
| Category | Repeat purchase rate |
|---|---|
| CBD products | 36.2% |
| Sports clothing and gadgets | 33% |
| Supplements | 29.1% |
| Meal deliveries | 29% |
| Tea | 20.9% |
Source: Metrilo, 65 DTC businesses, period not stated.
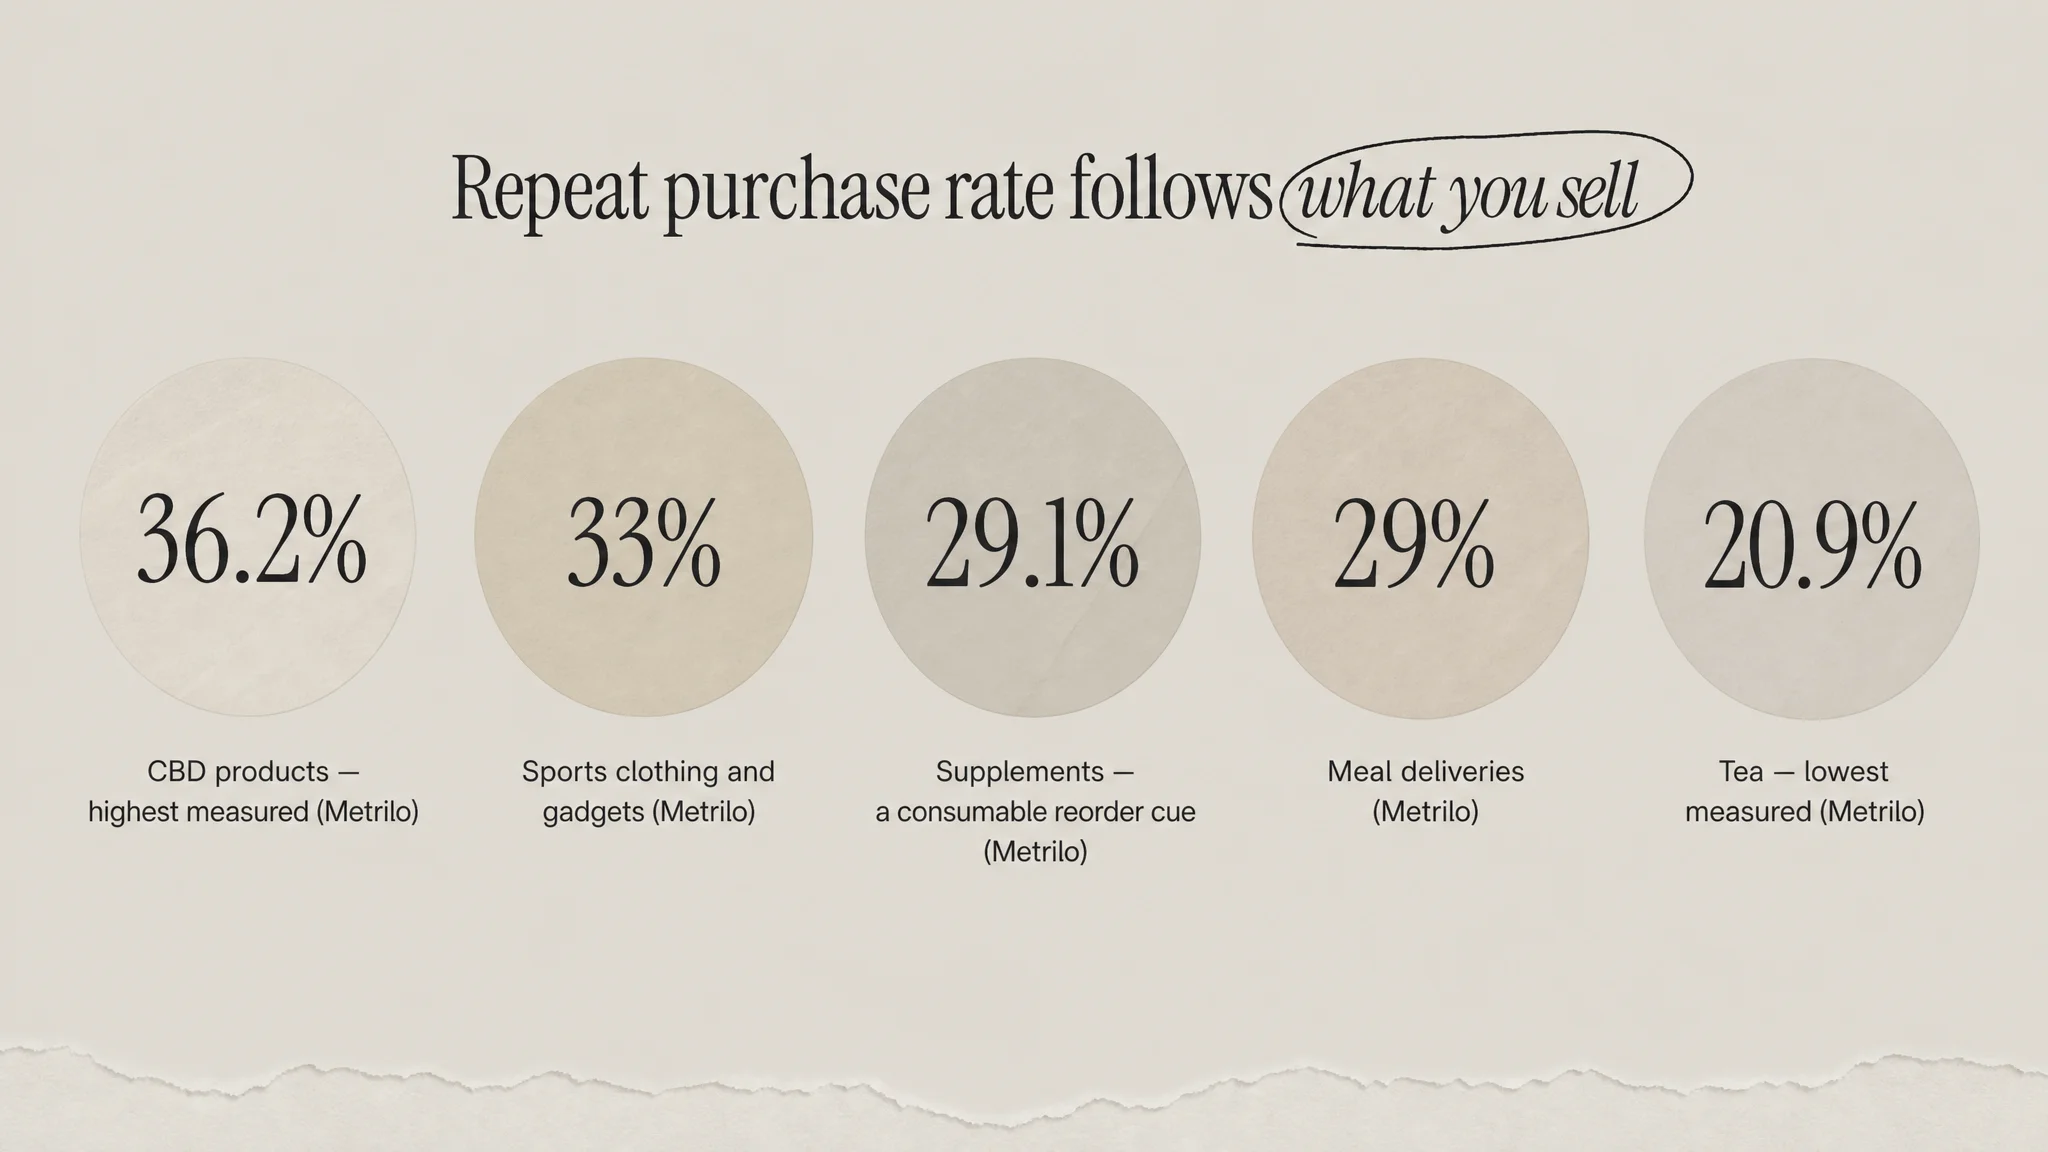
Notice the pattern. The categories at the top are consumables with a physiological or habitual reason to reorder. The categories at the bottom are either low-frequency by nature (home goods) or highly substitutable (tea). Retention is partly a marketing outcome and partly a property of what you sell, and no amount of flow-building turns a mattress into a supplement.
Beauty in detail, because the sub-category spread is instructive
Metrilo's beauty-specific analysis found an overall retention rate of 23%, with about 1.6 orders per customer and an average customer lifetime value of $138. Within beauty, the same page reports retention ranging from 13.2% for haircare up to 36.1% for specialised products.
That internal spread, 13% to 36% inside a single category, is the strongest argument against benchmarking yourself against a category average at all. If you sell haircare and you compare yourself to "health and beauty at 21%," you will conclude you are failing when you may be performing normally for your actual sub-category.
How long should you wait for the second order?
Retention rate on its own is a trap, because it says nothing about the window. A 25% retention rate means something very different for meal delivery than for coffee, and the reason is purchase cadence.
| Category | Average time between orders |
|---|---|
| Meal deliveries | 41 days |
| Sports clothing | 71 days |
| Beauty (overall) | 107 days |
| Coffee | 148 days |
Source: Metrilo.
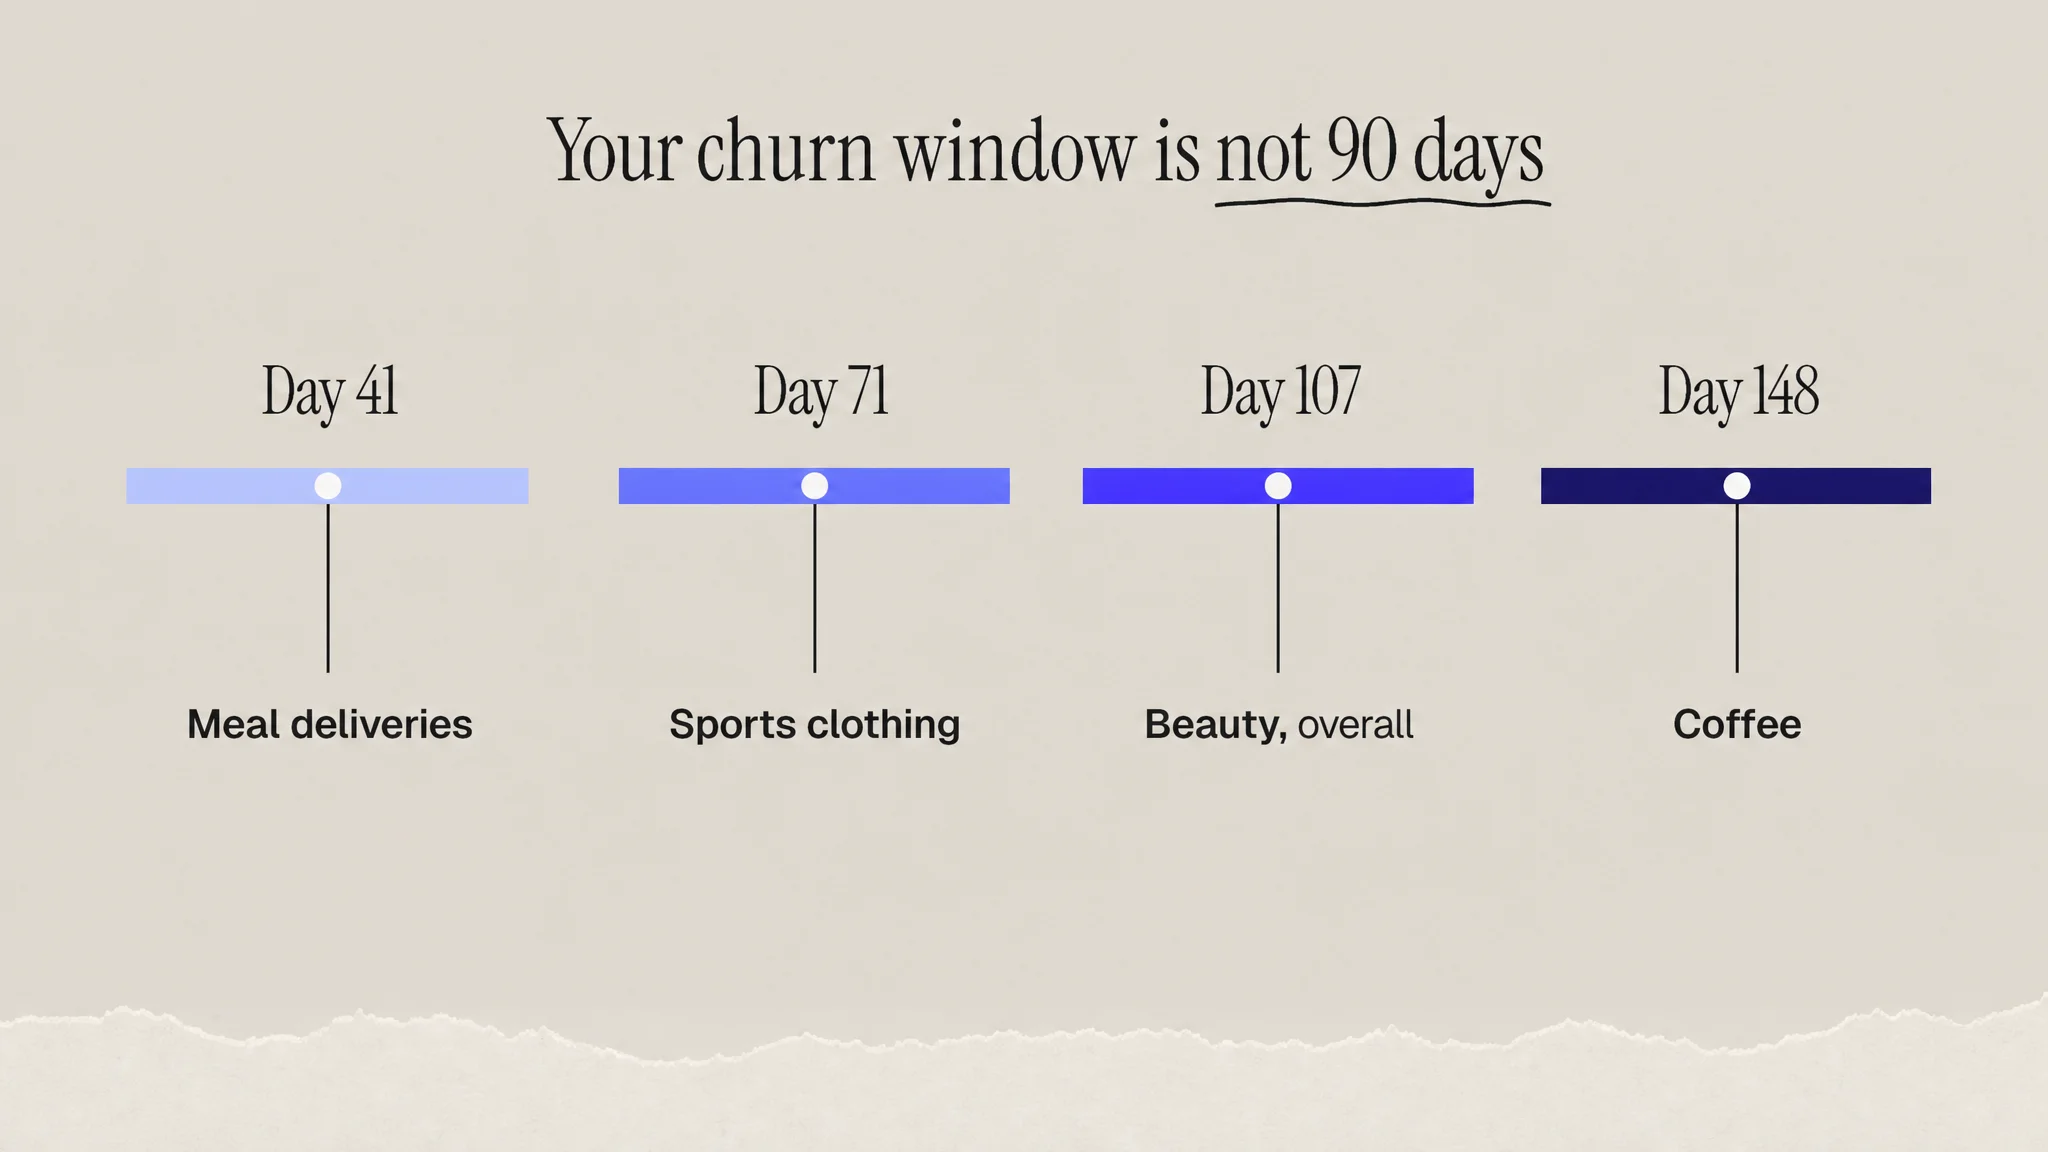
This is the practical use of the number. If your category reorders every 107 days on average and you are measuring retention on a 90 day window, you are counting healthy customers as churned. Worse, you are probably firing win-back campaigns at people who were never going to buy yet, which trains them to ignore you. Set your replenishment flow timing off your own observed cadence, not off a generic 30, 60, 90 cycle.
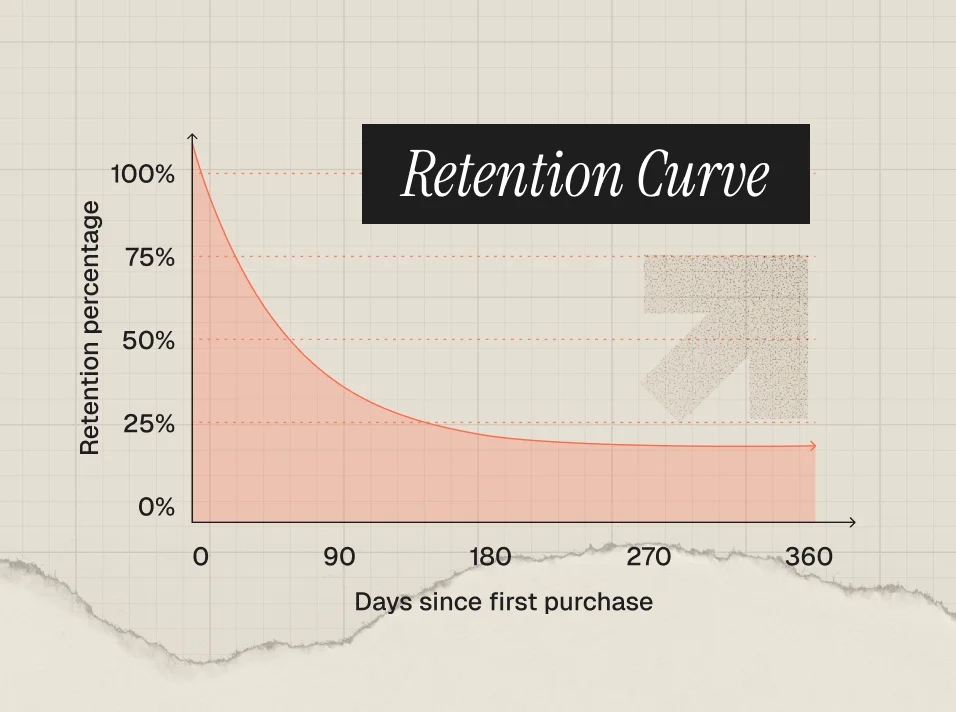
The measurement discipline that fixes this is cohort analysis rather than snapshot reporting. If that distinction is new, start with what cohort analysis is and how to read a retention curve, then look at why cohort LTV and blended LTV tell you different stories.
Business model moves retention more than category does
Here is the finding that should reorder your roadmap. The single largest verified retention differential in ecommerce is not between categories. It is between subscription and one-time purchase inside the same category.
Chewy reported that Autoship customer sales accounted for 83.3% of net sales for fiscal 2025, rising to 84.0% in the fourth quarter, across 21.3 million active customers generating $591 each. That is not a marketing statistic, it is an audited number in a public company's results, and it describes a business that has converted the overwhelming majority of its revenue into recurring revenue.
Recharge, looking across 20,000 brands, found that "subscribers placed nearly 3x more orders than one-time shoppers". HelloFresh disclosed that by the end of Q4 2025, "a majority of orders were placed by customers who had previously ordered 50+ boxes".
The implication is uncomfortable if you sell one-time: your ceiling is set by your model before your lifecycle program gets a vote. If a subscription or autoship option is plausible for your product, that single change will move retention further than any email sequence. Our guide to subscription retention covers what changes once you make that shift.
And subscription churn is not a one-way door
Two findings from Recurly's dataset of 76 million subscribers are worth acting on. First, "3 out of 4 subscribers who pause eventually return to the service", which makes a pause option strictly better than a cancel-only flow. Second, "former subscribers drive nearly 1 in 4 new sign-ups," so your win-back list is a genuine acquisition channel rather than a graveyard. Recurly also found 52% of consumers cancelled at least one subscription in the past year due to lack of use, which points at onboarding and habit formation rather than price.
What retention is actually worth
The most-quoted number in retention marketing is that a 5% increase in retention raises profits by 25% to 95%. It is worth being precise about where that comes from: Harvard Business Review reports it, attributing the finding to Frederick Reichheld of Bain and Company. The same article states that "acquiring a new customer is anywhere from five to 25 times more expensive than retaining an existing one." Cite it that way rather than as a fresh 2026 statistic, because it is neither fresh nor originally framed as a 25% to 95% range.
For something genuinely current, McKinsey's June 2026 State of Grocery North America report found that loyalty members who redeem personalised offers "spend 4.3 times more annually than those who do not", and that roughly 35% of promotions are fully personalised today with an expected jump to 55% within two to three years.
On the cost side of the equation, Yotpo's 2026 analysis reports that "Customer Acquisition Costs (CAC) have risen structurally by 25-40% depending on the channel" and that a healthy LTV to CAC ratio is now benchmarked at 3:1. Rising acquisition costs are precisely why the retention number you are benchmarking has moved from a nice-to-have metric to the constraint on growth. If you have not modelled that relationship for your own brand, CAC versus LTV is the place to start, and customer LTV covers the definitions.
How to use these benchmarks without misleading yourself
- Benchmark against your own trailing cohorts first. Your Q1 cohort versus your Q3 cohort is a cleaner signal than your brand versus a 2023 industry average, because it holds product, price and audience roughly constant.
- Match the measurement window to your category's cadence. Use the time-between-orders table above to set the window, not a default 30 or 90 days.
- Segment before you compare. A blended retention rate across a hero SKU and a gift SKU is two businesses averaged into one meaningless number.
- Check the source's sample. Platform benchmark reports draw from that platform's own customers, which is a self-selected population. Directional, not authoritative.
- Fix the model before the tactics. If subscription is viable for your product, that decision outranks every flow on your backlog.
For the tactical layer once your measurement is honest, see our guide to improving customer retention in ecommerce, and customer retention rates by industry for the wider industry view.
The bottom line
Roughly 3 in 10 ecommerce customers place a second order. Your category shifts that by ten points or so in either direction, your sub-category shifts it further, and your business model can move it more than everything else combined. The benchmarks in this article are the best verified numbers available, and most of them are older than the pages quoting them admit. Use them to orient, then manage the only trend that is genuinely yours: whether this month's cohort is retaining better than last month's.
Sources
- Metrilo, Customer Retention in DTC Brands report (65 DTC businesses, period not stated)
- Metrilo, Repeat Purchase Rate by category
- Metrilo, Beauty brands ecommerce benchmarks
- Decile, 2023 Benchmarking Guide (2023 data)
- Shopify, Average customer retention rate by industry
- Chewy, Inc. fiscal Q4 and full year 2025 results
- Recharge, 2026 Subscription Trend Report (20,000 brands)
- Recurly, State of Subscriptions report (76 million subscribers)
- HelloFresh SE, Q4 and FY 2025 press release
- Harvard Business Review, The Value of Keeping the Right Customers
- McKinsey and Company, The State of Grocery North America (June 2026)
- Yotpo, DTC brand comparison (2026)
Frequently Asked Questions
What is a good customer retention rate for ecommerce in 2026?
Roughly 3 in 10 customers place a second order. Metrilo puts the DTC retention rate at 28.2% across 65 businesses, and Decile's benchmarking data puts the all-brand average at 30% over a 12 month window. Treat anything near 30% as normal rather than good, and compare within your own sub-category, because the spread runs from about 12% in home goods to 36% in CBD.
Which ecommerce categories have the highest repeat purchase rates?
Consumables lead. Metrilo's data shows CBD products highest at 36.2%, followed by sports clothing and gadgets at 33%, supplements at 29.1% and meal deliveries at 29%. Tea is lowest at 20.9%. In Decile's categories, food and beverage ranks top at 23% retention and home goods bottom at 12%. Products with a physiological or habitual reason to reorder retain best.
How long should you wait before treating an ecommerce customer as churned?
Set the window from your category's own purchase cadence. Metrilo's data shows average time between orders of 41 days for meal deliveries, 71 days for sports clothing, 107 days for beauty and 148 days for coffee. If you measure retention on a 90 day window in a category that reorders every 107 days, you will count healthy customers as lost and fire win-back campaigns far too early.
Does a subscription model improve retention more than better marketing?
Usually yes. Chewy took 83.3% of fiscal 2025 net sales through Autoship, and Recharge found subscribers place nearly 3x more orders than one-time shoppers across 20,000 brands. Business model sets the ceiling before your lifecycle program gets a vote, so if subscription or autoship suits your product, that decision will move retention further than any email sequence.
Why do 2026 ecommerce retention benchmarks vary so much between sources?
Mostly vintage and formula. Most pages labelled 2026 are recycling Decile's 2023 guide or Metrilo's undated dataset without saying so, and sources differ on whether they report retention rate or repurchase rate, and over what window. Decile's own table shows fashion at 19% retention but 30% repurchase. Always check the data date and the definition before quoting a number.