.webp)

Summarize this documentation using AI
Blended LTV divides total customer lifetime revenue by total customers to produce one average figure. Cohort LTV groups customers by when and how they were acquired, then tracks each group's cumulative revenue over time. The difference matters: blended LTV is fine for a board slide but useless for a decision, because the average smears together one-and-done discount buyers and high-value repeat cohorts. Cohort LTV exposes three things blended never can — your real payback window, which lever actually compounds, and whether your automated flows are earning their keep. For any scale-or-kill retention decision, use the cohort view.
Key Takeaways
- Blended LTV is an average; it optimizes for a customer who doesn't exist by hiding the spread between cohorts.
- Cohort LTV reveals your payback window — two cohorts with the same $250–450 CLV (strong, per Shopify commerce benchmarks) can have wildly different days-to-repay-CAC.
- Repeat-purchase economics compound: lifting repeat-customer rate from 50% to 60% can raise LTV 40%+.
- Repeat rates are category-specific — ~5–8% accessories, 8–14% beauty, 12–18% food & beverage — so benchmark against your own curve.
- Automated flows drive 30–50% of lifecycle email revenue (Klaviyo benchmarks); only cohort LTV isolates that contribution.
1. What blended LTV is (and what it hides)
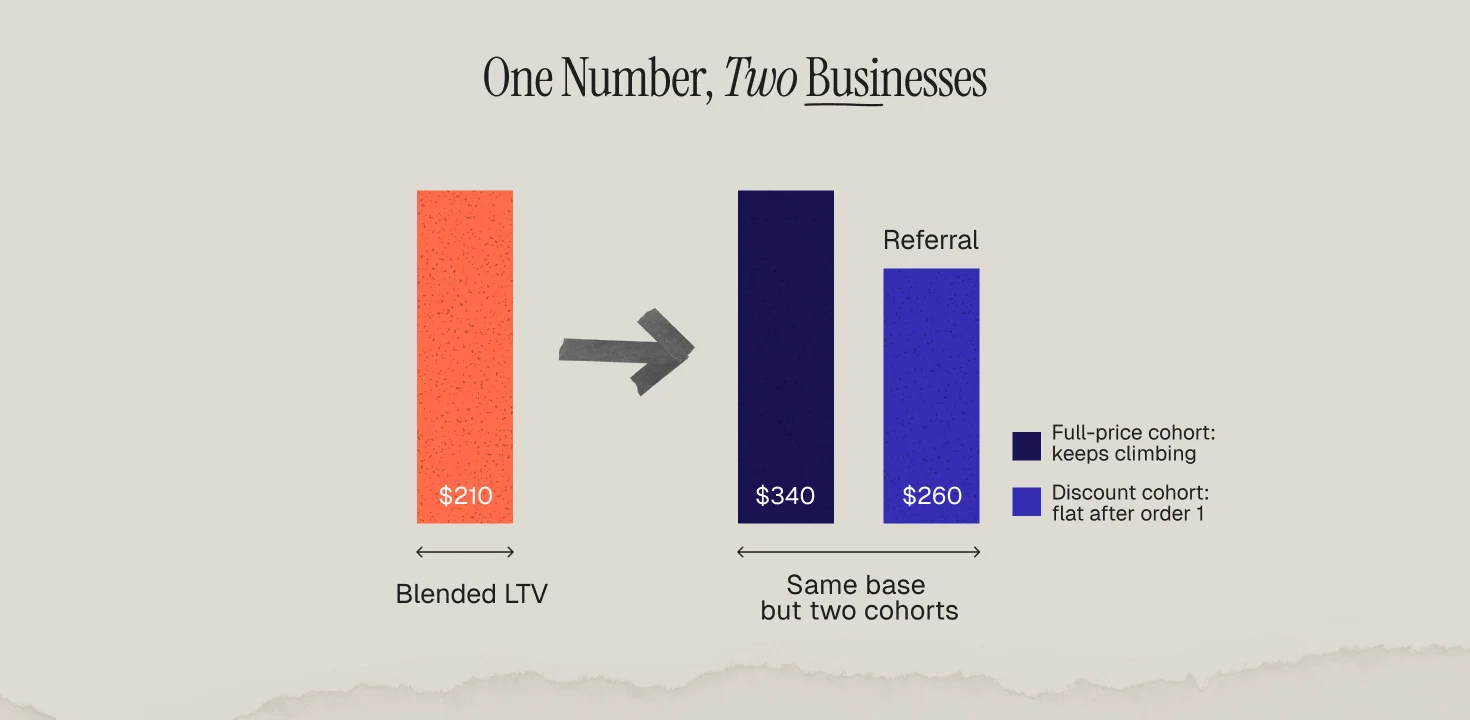
Blended LTV totals all customers' lifetime spend and divides by headcount — one tidy number you set next to CAC. The problem is structural: it's an average, and averages hide the variance you're trying to manage. Two different businesses live inside it — the discount cohort that bought once and never returned, and the full-price cohort that hit the post-purchase flow and bought again. Blended LTV smears them together and tells you nothing about which to make more of.
2. What cohort LTV is
Cohort LTV uses the same order data, grouped by acquisition month (and ideally by acquisition source or offer). You then plot cumulative revenue per customer for each cohort over time. The shape of the curve (flat = one-and-done; climbing = working) and the spread between cohorts tell you whether your offer or channel is deciding LTV before retention ever gets a shot.
3. Three things cohort LTV shows that blended never will
3.1 Your real payback window
Blended LTV is a lifetime figure with no clock. Cohort LTV shows days-to-repay-CAC per group. A brand with $250–450 CLV and a 9-month payback is a very different business than the same CLV at 6 weeks — and blended can't tell them apart.

3.2 Which lever actually compounds
Lifting repeat-customer rate from 50% to 60% can raise LTV 40%+, because retained cohorts stack. You only see that leverage by watching cohorts age — and it's category-specific (accessories ~5–8%, beauty 8–14%, F&B 12–18%).
3.3 Whether your flows earn their keep
Flows drive 30–50% of lifecycle email revenue (Klaviyo benchmarks), but blended can't isolate it. Compare the cohort that went through your post-purchase flow against the one that didn't — the gap is the flow's contribution, a number you can take to a CFO.
4. How to build your first cohort LTV view
Pull 6–12 months of orders. Group customers by acquisition month. Plot cumulative revenue per customer per cohort over time. Read two things: curve shape and cohort spread. Most teams discover their best blended quarter was carried by one or two cohorts, while discount-led quarters poisoned the average for a year.
5. When blended LTV is still fine
Blended LTV is acceptable for a high-level board narrative or a quick directional sanity-check against CAC. It breaks down the moment you need to choose — which channel to scale, which offer to kill, which flow to build. Those are cohort decisions.
Frequently Asked Questions
What is blended LTV?
Total customer lifetime revenue divided by total customers — a single average figure.
What is cohort LTV?
Lifetime value tracked separately for groups of customers defined by when/how they were acquired.
Why is cohort LTV better for decisions?
It exposes payback window, the compounding lever, and flow contribution — all of which blended averages hide.
Is blended LTV ever useful?
Yes, for high-level board narratives and quick directional checks against CAC — not for scale-or-kill decisions.
How do I calculate cohort LTV?
Group customers by acquisition month, plot cumulative revenue per customer per cohort over time, and compare curve shape and spread.