Summarize this documentation using AI
A lifecycle marketing audit is a structured review of the data, segmentation, automations, channels, deliverability, and measurement behind your email, SMS, and push programs. The goal is simple: find where revenue is leaking, quantify it, and rank the fixes by impact. Done well, an audit takes 2 to 3 weeks and produces a prioritized roadmap, not a 60-page PDF nobody reads.
Most B2C and DTC teams audit their lifecycle program for one of three reasons: flow revenue has plateaued, a new owner inherits an account built by three previous agencies, or leadership suspects the numbers in the ESP dashboard do not match what finance sees. Whatever the trigger, the process is the same. This guide walks through the exact 7-step framework we use at Propel when we run a martech and lifecycle audit for clients on Klaviyo, Customer.io, and Braze.
The stakes are worth stating up front. According to Litmus research, 30% of marketing leaders report $36 to $50 in return for every $1 spent on email, and retail and ecommerce brands report the highest ROI of any industry at 45:1. If your program is underperforming those numbers, an audit is how you find out why.
What is a lifecycle marketing audit?
A lifecycle marketing audit is a systematic evaluation of how your brand acquires, activates, retains, and wins back customers across owned channels. It examines six layers: the data feeding your ESP, the segments built on that data, the automated flows triggered by it, the mix of channels delivering messages, the deliverability infrastructure carrying them, and the measurement framework that tells you if any of it worked. The output is a scored gap analysis plus a ranked roadmap of fixes.
Notice what an audit is not: it is not a template teardown or a subject-line critique. Creative matters, but in our experience the biggest revenue leaks sit in data and coverage gaps, which is why lifecycle marketing fails at most brands long before copy becomes the constraint.
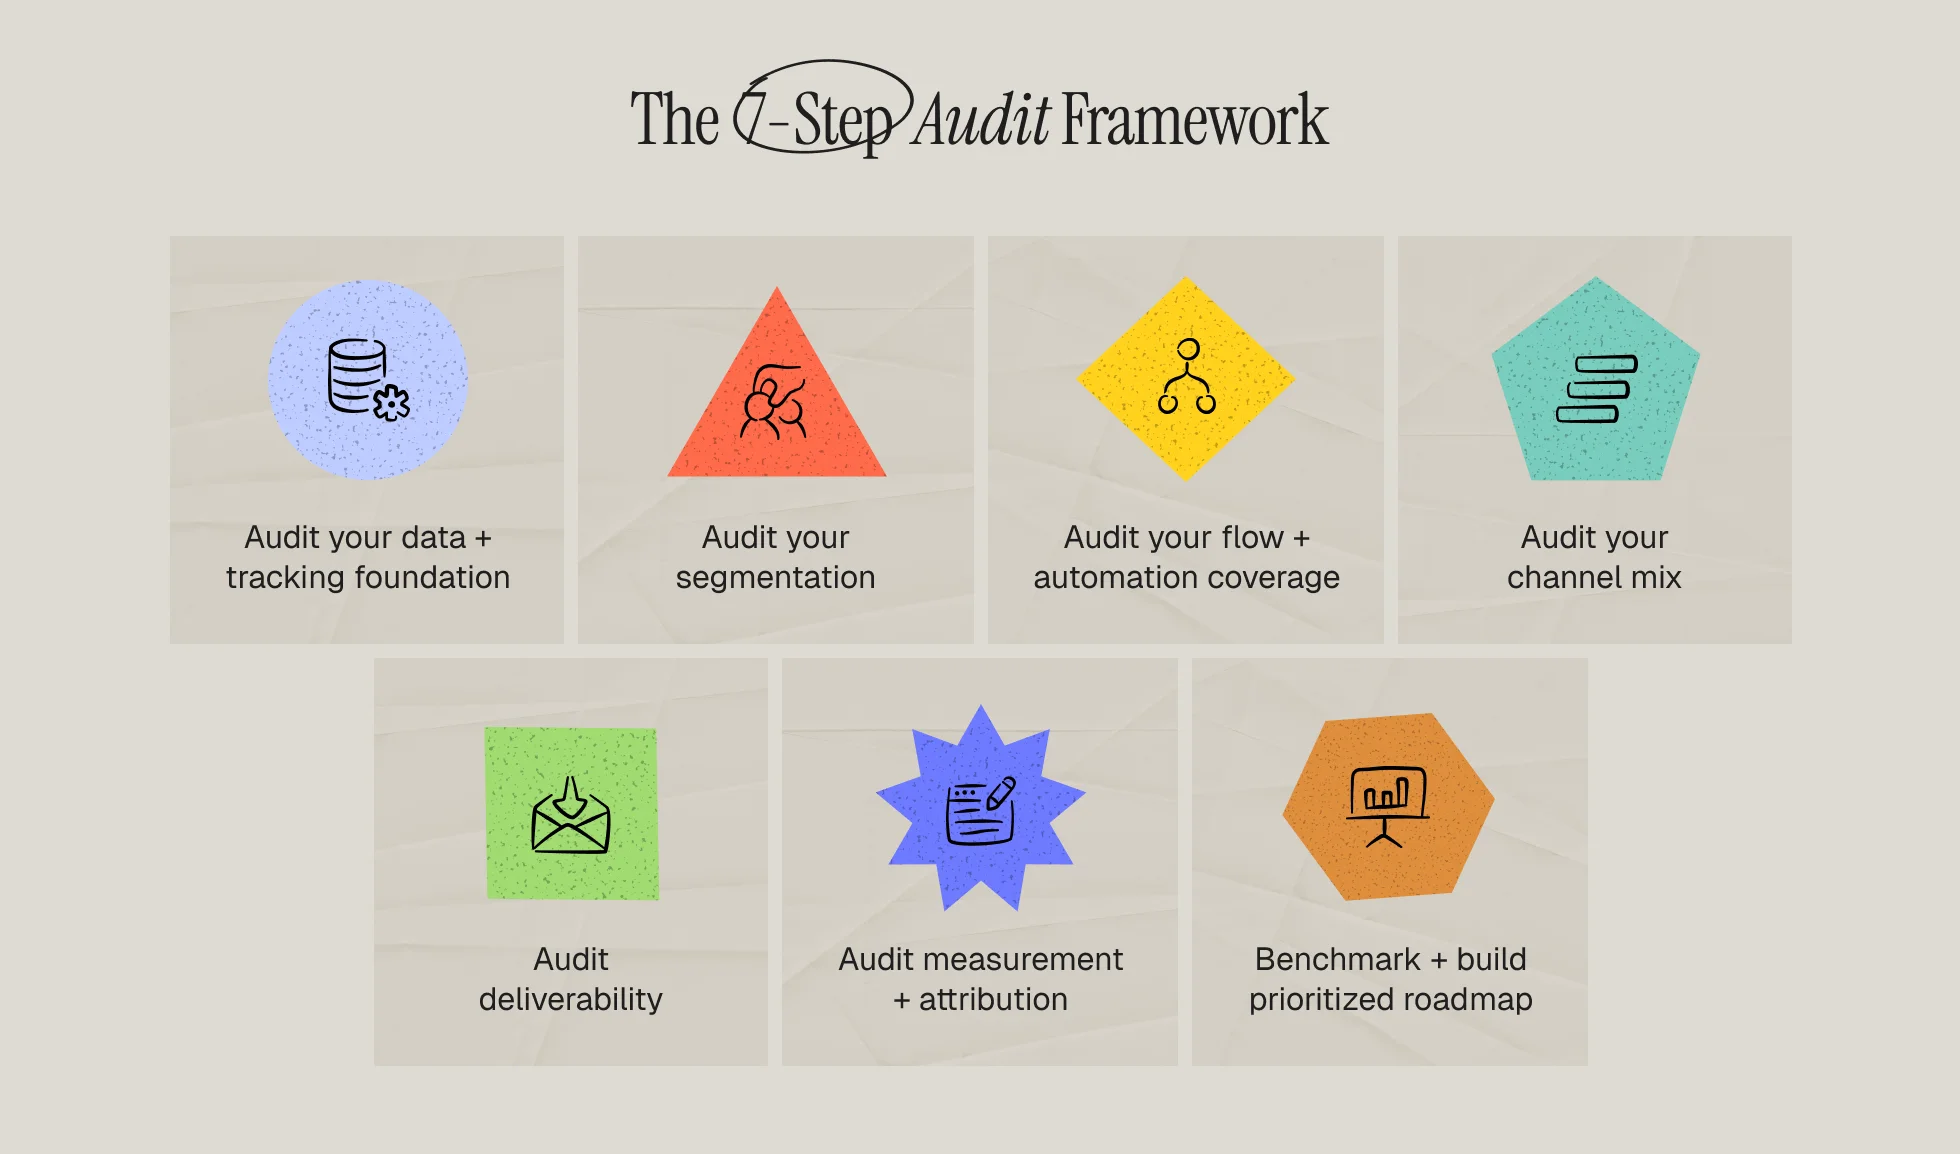
Step 1: Audit your data and tracking foundation
Every downstream problem traces back to data. Before you look at a single flow, verify what your ESP actually knows about each customer.
Work through this checklist:
- Event coverage. Are the core events firing: viewed product, added to cart, started checkout, placed order, subscription started, subscription cancelled? Pull a random sample of 20 customer profiles and check that recent site behavior appears on each one.
- Identity resolution. What percentage of site traffic is identified? If cookied profiles are not merging with logged-in profiles, your abandonment flows are silently skipping most eligible buyers.
- Property hygiene. Look for duplicate properties (first_name vs firstName), stale sync fields, and currency or timezone mismatches between your store, CDP, and ESP.
- Integration health. Confirm the Shopify, Segment, or backend API sync has no gaps. Compare 30 days of order events in the ESP against actual orders in your commerce platform. A discrepancy over 3 to 5% means triggers are misfiring.
Score this layer honestly. A brand with broken event tracking should not touch segmentation until it is fixed, and a proper martech audit focused on churn always starts here.
Step 2: Audit your segmentation
With data verified, evaluate how it is being used to divide your audience. Ask three questions:
- Do segments reflect behavior, not just demographics? Purchase recency, frequency, monetary value, category affinity, and engagement recency should drive your core segments. If everything is "all subscribers" plus a country split, that is a red flag.
- Do you have the non-negotiable segments? At minimum: engaged 30/60/90 day segments, VIPs or top-decile spenders, at-risk customers past their expected reorder window, one-time buyers vs repeat buyers, and a suppression segment for chronic non-engagers.
- Are segments actually used? Audit the last 90 days of campaigns. If 80% of sends went to the full list, segmentation exists on paper only.
An RFM analysis is the fastest way to establish a behavioral baseline if none exists. Document each active segment, its size, its refresh logic, and the last time it received a targeted message.
Step 3: Audit your flow and automation coverage
This is where most audits find the largest immediate revenue. Klaviyo's benchmark data shows that automated flows generate up to 30x more revenue per recipient than one-off campaigns, so every missing or broken flow is a compounding leak.
Map your existing automations against the full coverage matrix:
- Acquisition and activation: welcome series for non-buyers, new customer onboarding for first purchasers.
- Conversion: cart abandonment, browse abandonment, and checkout abandonment as distinct flows. The distinction matters because intent levels differ sharply, which we break down in our guide to cart abandonment vs browse abandonment flows. With Baymard Institute documenting an average cart abandonment rate of 70.22%, this is usually the highest-leverage gap.
- Retention: post-purchase education, cross-sell, replenishment, review requests, and subscription-specific flows like payment failure recovery.
- Reactivation: a win-back flow for lapsed customers and a sunset flow for the chronically unengaged.
For each existing flow, record: trigger logic, filter logic, message count, send timing, last edit date, and 90-day revenue per recipient. Compare against benchmarks. Klaviyo's abandoned cart benchmark report puts the average abandoned cart flow at $3.65 revenue per recipient with a 50.5% open rate, while top-decile performers reach $28.89 RPR. If your cart flow sits under a dollar, you have found your first roadmap item.
Step 4: Audit your channel mix
Email-only programs leave money on the table, but bolted-on channels create fatigue. Review three things:
- Channel roles. Does each channel have a defined job? A common working model: email carries education and merchandising, SMS carries urgency and transactional moments, push carries app re-engagement. If SMS is just a shorter copy of every email, expect opt-out spikes.
- Frequency and overlap. Pull one high-value customer profile and list every message they received in the last 30 days across channels. Brands are routinely shocked to find 25+ touches with no global frequency cap.
- Consent and quiet hours. Verify SMS consent language, quiet-hour enforcement, and regional compliance settings. This is a legal exposure check as much as a marketing one.
If channels operate in silos, orchestration is the fix, and our guide to omnichannel orchestration covers how to sequence them from one decision layer.
Step 5: Audit deliverability
None of the above matters if messages land in spam. Deliverability has hard requirements now, not best practices. Since February 2024, Google's email sender guidelines require bulk senders (5,000+ messages per day to Gmail) to authenticate with SPF, DKIM, and DMARC, support one-click unsubscribe, and keep spam complaint rates below 0.3% in Postmaster Tools, with Google recommending you stay under 0.1%. Yahoo enforces matching requirements.
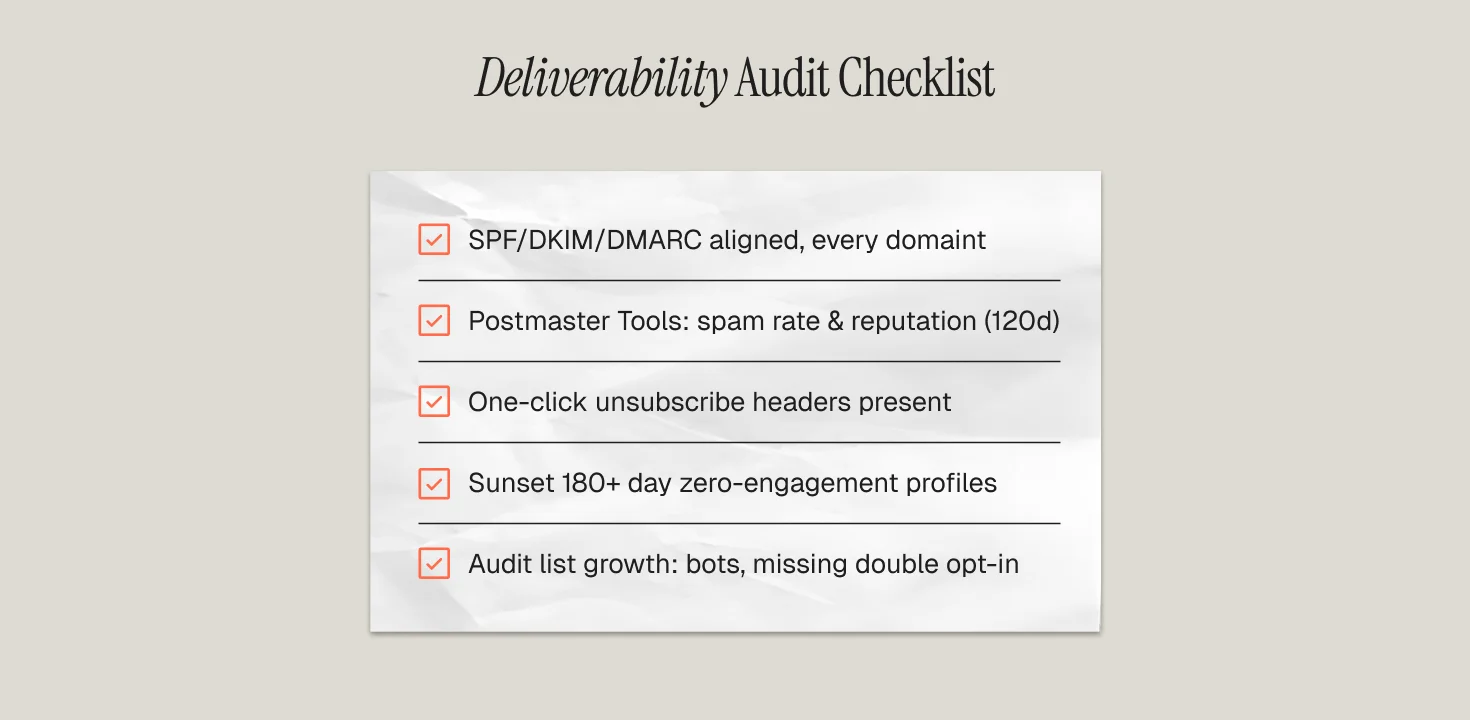
Your deliverability audit checklist:
- Confirm SPF, DKIM, and DMARC records exist and align for every sending domain and subdomain.
- Check Gmail Postmaster Tools for spam rate, domain reputation, and IP reputation trends over 120 days.
- Verify one-click unsubscribe headers (List-Unsubscribe-Post) are present on marketing sends.
- Review sunset policy: are you still mailing profiles with zero engagement in 180+ days?
- Inspect list growth sources for bot signups and missing double opt-in on high-risk forms.
Inbox placement typically explains sudden flow revenue drops that teams misdiagnose as creative fatigue. Our primer on what email deliverability is covers the mechanics in depth.
Step 6: Audit measurement and attribution
ESP dashboards flatter themselves. Default attribution windows (often 5-day click and open for email) routinely claim revenue that would have happened anyway. Audit the measurement layer with these checks:
- Attribution settings. Document the exact windows and models in your ESP. Shorten open-based attribution, since Apple Mail Privacy Protection inflates opens.
- Cross-tool reconciliation. Compare ESP-claimed revenue against your commerce platform and GA4 or your CDP. Gaps above 20 to 30% deserve explanation, and understanding DTC revenue attribution across Klaviyo, Braze, and Customer.io helps you set defensible windows.
- Metric hierarchy. The program should be managed on revenue per email, flow conversion rates, list growth net of churn, and cohort repeat rates, not opens.
- Holdout capability. Can you run a global holdout to measure incrementality? If not, note it as a roadmap item.
Step 7: Benchmark everything and build the prioritized roadmap
The final step turns findings into a plan. Benchmark each audited layer against industry data, using sources like our ecommerce email benchmarks and Klaviyo's published flow data, then score every gap on two axes: estimated revenue impact and implementation effort.
A simple output format that works:
- Quick wins (weeks 1 to 4): fix broken triggers, add missing authentication records, launch the highest-intent missing flow.
- Core builds (months 2 to 3): segmentation rebuild, channel orchestration rules, holdout testing framework.
- Structural projects (quarter 2+): CDP or integration work, subscription retention programs, predictive churn models.
Assign an owner and a measurable target to every line. An audit without a sequenced roadmap is just criticism.
How Propel runs lifecycle marketing audits
Propel is a lifecycle and retention marketing agency for B2C, DTC, subscription, and health brands, and a Platinum Customer.io partner. Our audit engagement compresses this 7-step framework into 2 to 3 weeks: we score all six layers, reconcile your ESP revenue claims against source-of-truth data, and hand you a ranked roadmap with revenue estimates attached to each fix. Then, if you want, our team executes it through our full lifecycle marketing services.
If your flows have plateaued or you have inherited a program you do not trust, start with the audit.
Frequently Asked Questions
How often should you audit your lifecycle marketing program?
Run a full 7-step audit once a year, or immediately after a major change: a platform migration, a new agency or hire, a redesigned site, or a sudden drop in flow revenue. In between, run lightweight quarterly checks on deliverability metrics, flow trigger health, and attribution reconciliation, since those layers degrade fastest and cause the largest silent revenue losses.
How long does a lifecycle marketing audit take?
A thorough audit of a B2C or DTC program takes 2 to 3 weeks. Roughly one week goes to data, tracking, and integration verification, one week to flows, segmentation, channels, and deliverability review, and the final stretch to benchmarking and building the prioritized roadmap. Simple single-channel programs on one ESP can be audited in about a week.
What tools do you need to audit a lifecycle marketing program?
You need admin access to your ESP (Klaviyo, Customer.io, or Braze), your commerce or subscription platform, Gmail Postmaster Tools, your DNS records for SPF, DKIM, and DMARC verification, and your analytics layer (GA4, Mixpanel, or Amplitude). A CDP like Segment helps verify event delivery. No specialized audit software is required, though a scoring spreadsheet keeps findings comparable across layers.
What are the most common problems a lifecycle audit finds?
The most common findings are broken or missing event tracking that silently shrinks flow audiences, absent high-intent flows like browse abandonment or win-back, campaigns sent to the full list instead of segments, missing DMARC records and one-click unsubscribe headers, and ESP attribution windows that overstate email revenue versus the commerce platform. Data and coverage gaps almost always outweigh creative problems.
What benchmarks should you compare your flows against?
Compare each flow's revenue per recipient, open rate, click rate, and conversion rate against published platform data. For example, Klaviyo reports the average abandoned cart flow earns $3.65 per recipient with a 50.5% open rate, while top 10% performers reach $28.89 per recipient. Also benchmark against your own history: a flow trending down 20% quarter over quarter is a finding regardless of industry averages.