Summarize this documentation using AI
Key Takeaways
- The best-evidenced ROI number in lifecycle marketing is the flow-versus-campaign gap: across more than 183,000 Klaviyo customers, automated flows produce nearly 41% of email revenue from 5.3% of sends.
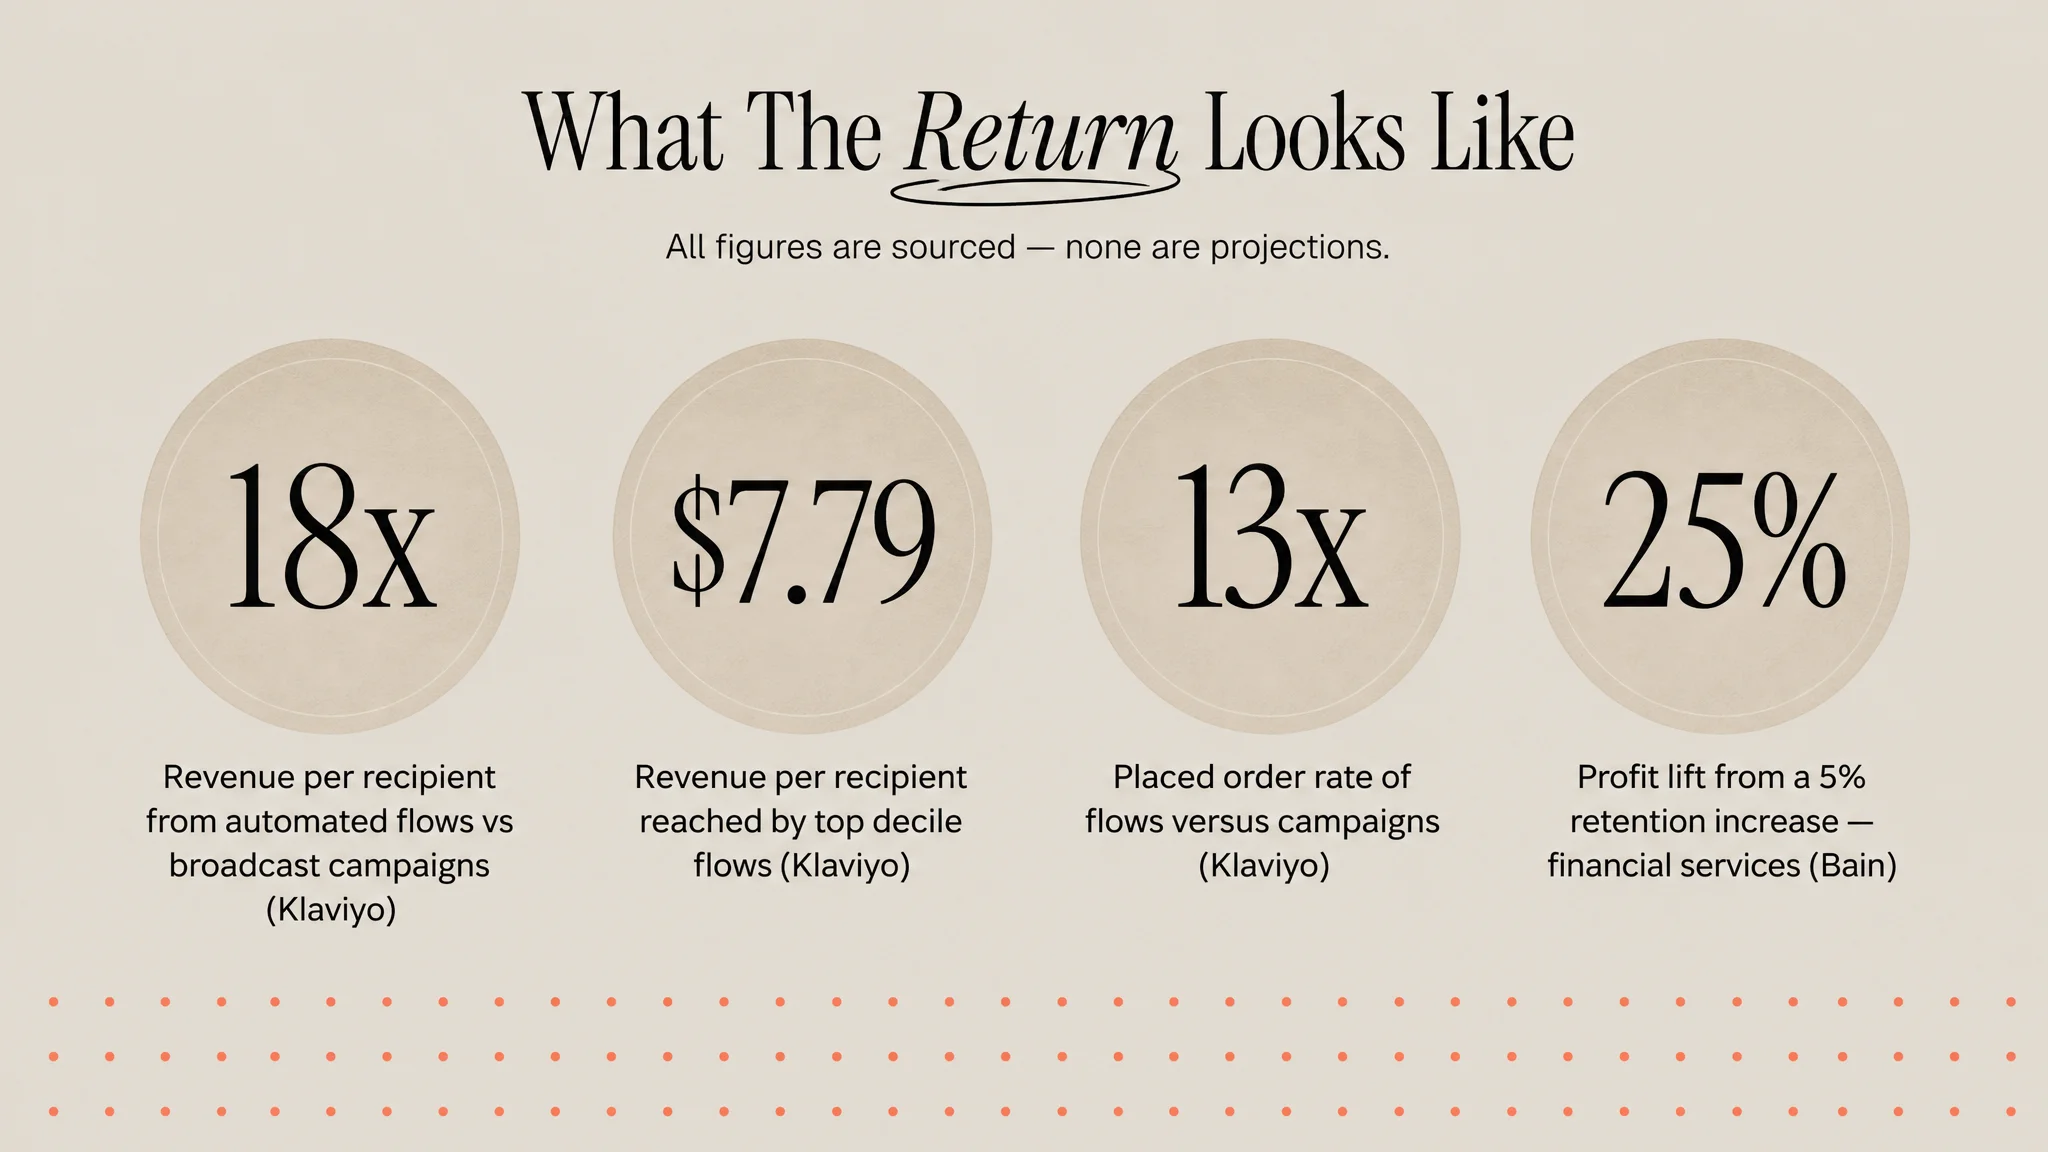
- Revenue per recipient from flows runs nearly 18 times higher than from campaigns, click rates more than three times higher (5.58% against 1.69%), and placed order rates 13 times higher.
- Flows also acquire: nearly 48% of flow-driven email revenue comes from new buyers, against 16% for campaigns. Automation is not only a retention channel.
- Build the ROI case on incremental margin against fully loaded cost, including the build hours. Platform fees are usually the smallest line in the model.
- The honest failure mode: automation ROI collapses when flows are built once and never maintained. Budget for upkeep or the model does not hold.
Most lifecycle automation ROI cases are built backwards. Someone divides attributed email revenue by the platform invoice, produces a number like 40:1, and everyone nods. The number is meaningless, because attributed revenue includes purchases that would have happened anyway and the platform invoice excludes the largest real cost, which is the time of the people building and maintaining the automation.
This piece builds the model the other way round: start from the published benchmark that actually isolates automation's contribution, work out what is incremental, subtract the full cost, and see what is left. The data is from 2026 and every figure is sourced.
The one benchmark that isolates automation
The cleanest available measurement of what automation contributes comes from Klaviyo's 2026 benchmark analysis, drawn from more than 183,000 customers. It compares automated flows against broadcast campaigns on the same accounts, which controls for brand, list and category in a way that cross-company averages cannot.
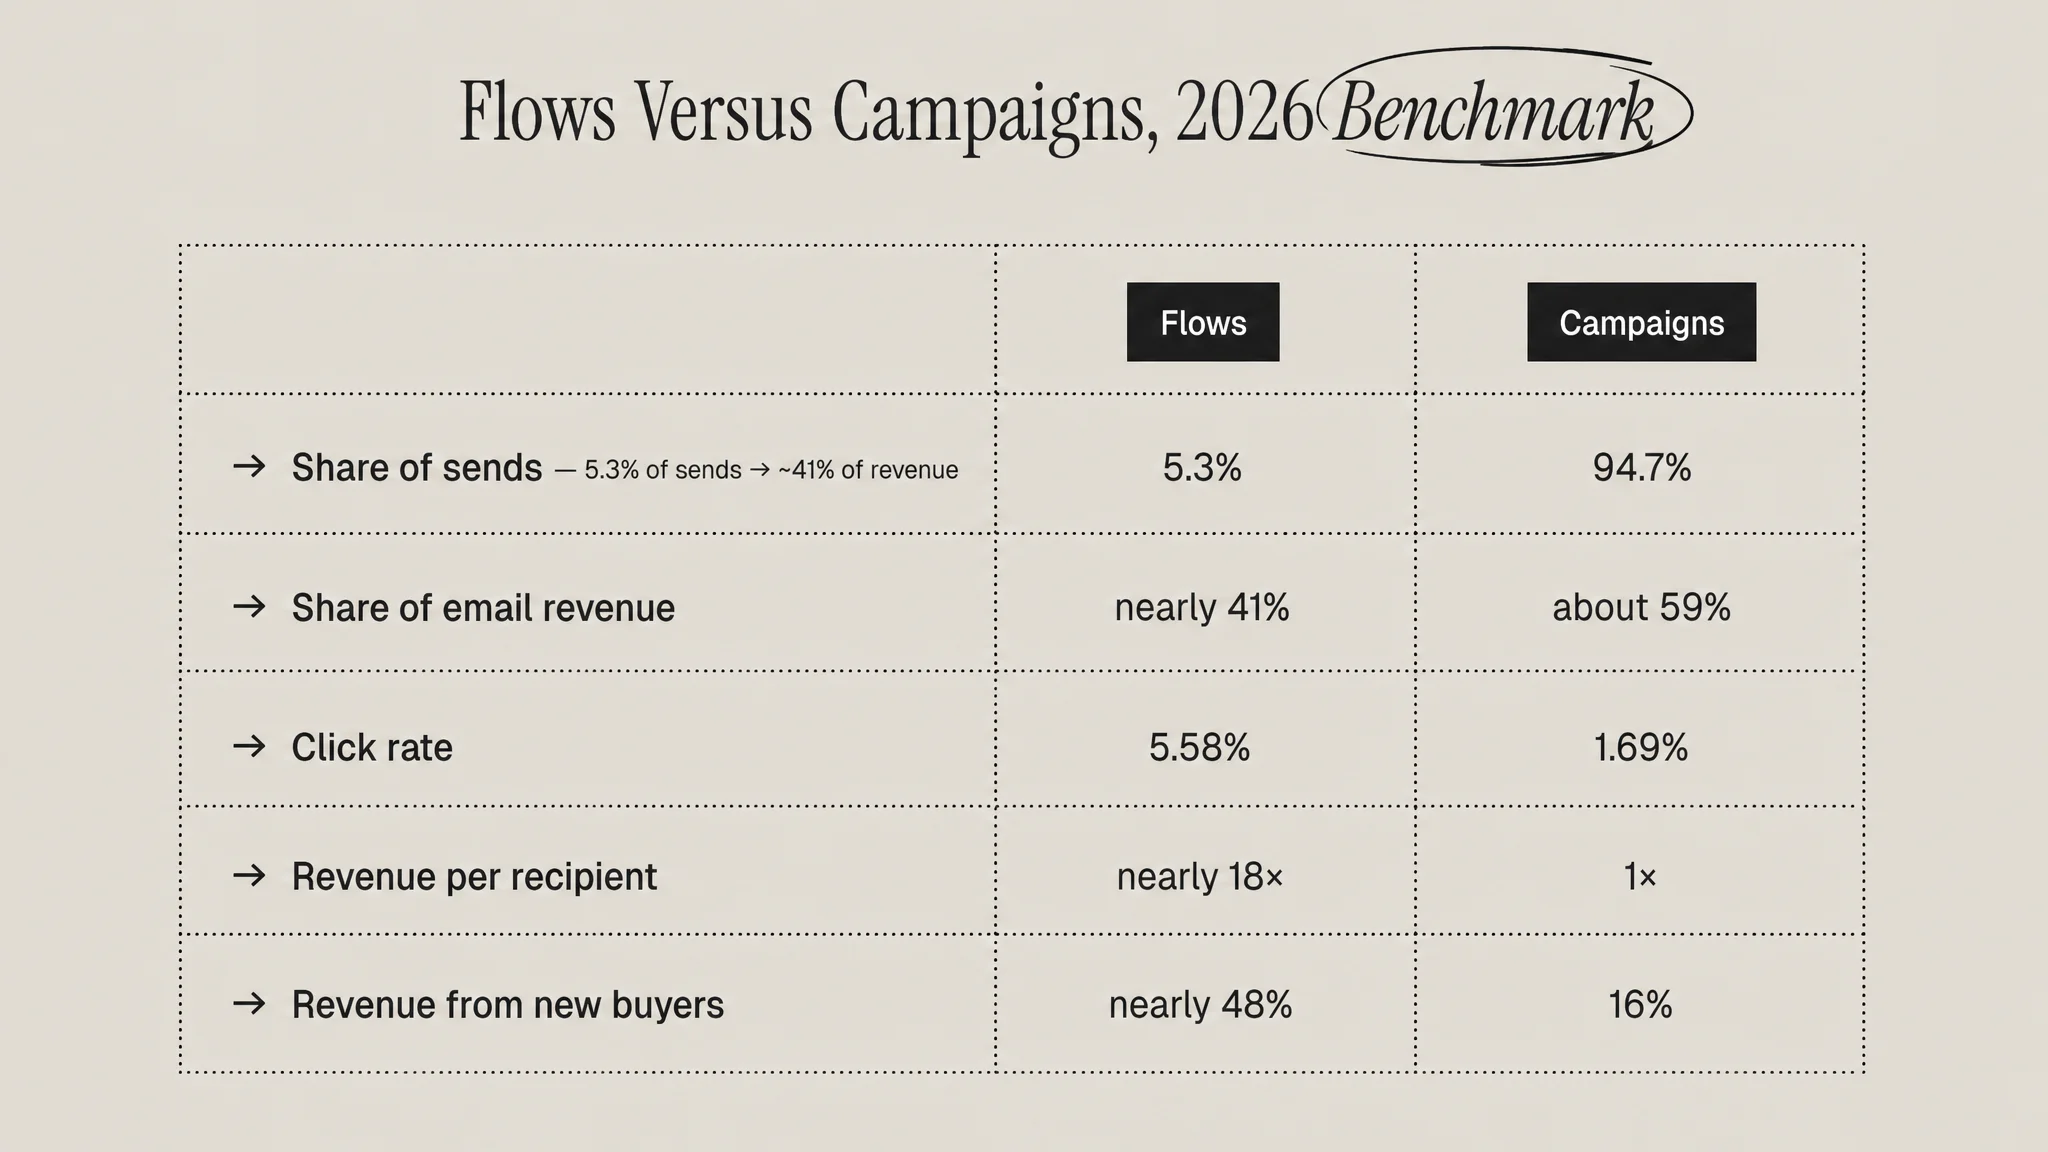
The findings, as published (Klaviyo 2026 email marketing benchmarks):
- Share of revenue against share of sends. Flows generate nearly 41% of total email revenue from just 5.3% of sends.
- Revenue per recipient. Flows deliver nearly 18 times higher revenue per recipient than campaigns.
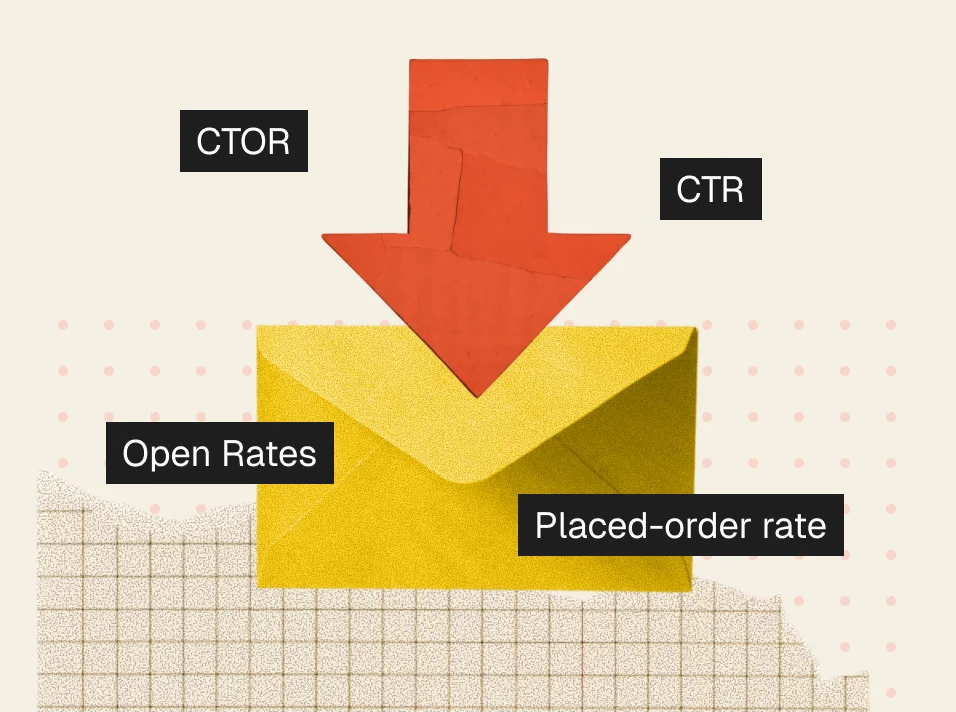
- Click rate. 5.58% for flows against 1.69% for campaigns, more than three times higher.
- Placed order rate. 13 times higher for flows.
- Top decile performance. The best flows reach revenue per recipient as high as $7.79 with click rates above 10%.
- New buyer contribution. Nearly 48% of flow-driven email revenue comes from new buyers, against just 16% for campaigns.
That last one gets overlooked. Automation is filed under retention, but almost half the revenue it produces comes from people buying for the first time. An abandoned checkout flow is an acquisition mechanism that happens to run on retention infrastructure. If your ROI case only counts repeat revenue, it is understating the return by roughly half.
Why the ratio, not the revenue, is the ROI signal
The 5.3% against 41% comparison is the heart of the case. It says the return is not coming from volume. Flows are not winning because they send more. They are winning because they send at the moment intent already exists.
That distinction has a direct budget implication. Adding campaign volume has a cost curve: more sends, more list fatigue, more deliverability risk, diminishing returns. Adding a flow has a build cost once and then produces revenue continuously with no incremental send cost worth modelling. The two investments do not behave alike, and a blended email ROI figure averages them into uselessness. What email deliverability is covers the cost side of volume, and what triggered messaging is covers the mechanism on the flow side.
Building the model properly
Here is the structure we use in engagements. It has four lines and the third one is the one everybody skips.
Line 1: incremental revenue, not attributed revenue
Attributed revenue is every purchase that touched an email. Incremental revenue is the subset that would not have happened otherwise. The gap between them is large, and the only honest way to size it is a holdout: suppress the flow for a random slice of eligible recipients and measure the difference in conversion.
If you have never run a holdout, assume your attributed number overstates incrementality substantially and build the business case at a discount until you have measured it. Any agency that will not run holdouts is selling you attribution, not results.
Line 2: margin, not revenue
Run the model on contribution margin. A 4x return on revenue at 30% gross margin is a 1.2x return on margin before you have paid anyone. This single substitution kills more bad automation projects than any other line in the model.
Line 3: fully loaded cost, including build and upkeep
The platform fee is the visible cost and usually the smallest one. The real cost is build hours, QA, creative, data plumbing and the ongoing maintenance that keeps a flow from decaying into irrelevance as the catalogue, the offer and the audience change.
Price a flow the way you would price a piece of software: build cost plus a maintenance allocation per year. A win-back sequence written for last year's assortment and never touched since is not producing the benchmark return, whatever the dashboard says.
Line 4: payback period, not annual ROI
Annual ROI flatters automation because the build cost is front-loaded and the revenue is continuous. Payback period is the more useful number for a finance conversation: how many weeks until this flow has returned its build cost in contribution margin. Well-built core flows typically pay back fast. Speculative ones do not, and the payback framing exposes which is which before you commit the quarter.
What the supporting evidence says about the upside
Three external anchors help size the ceiling.
Personalization. McKinsey puts the revenue lift from personalization at 10% to 15%, ranging from 5% to 25% by sector and execution quality, and finds that fast-growing companies derive 40% more of their revenue from personalization than slower-growing peers (McKinsey). Personalization is what flows do structurally, since a triggered message is personalized by timing before it is personalized by content.
Retention economics. Fred Reichheld's Bain research: "In financial services, for example, a 5% increase in customer retention produces more than a 25% increase in profit" (Bain & Company). Automation is the cheapest mechanism available for moving retention by a few points, which is where the leverage in that sentence lives.
The size of the problem. Average documented cart abandonment across 50 studies is 70.22% (Baymard Institute). Roughly seven in ten carts are a recoverable audience with demonstrated intent, and a checkout abandonment flow is the highest revenue per recipient asset most brands own.
AI, specifically. Klaviyo reports that AI-powered recommendations lift email click rates to 3.75% on average and 8.79% for top performers. Real, measured, and a click rate improvement rather than a retention improvement. Model it as a content optimisation on an existing flow, not as a new revenue line. We went into this further in AI-powered lifecycle marketing in 2026.
Where automation ROI actually fails
The flow library stops at two
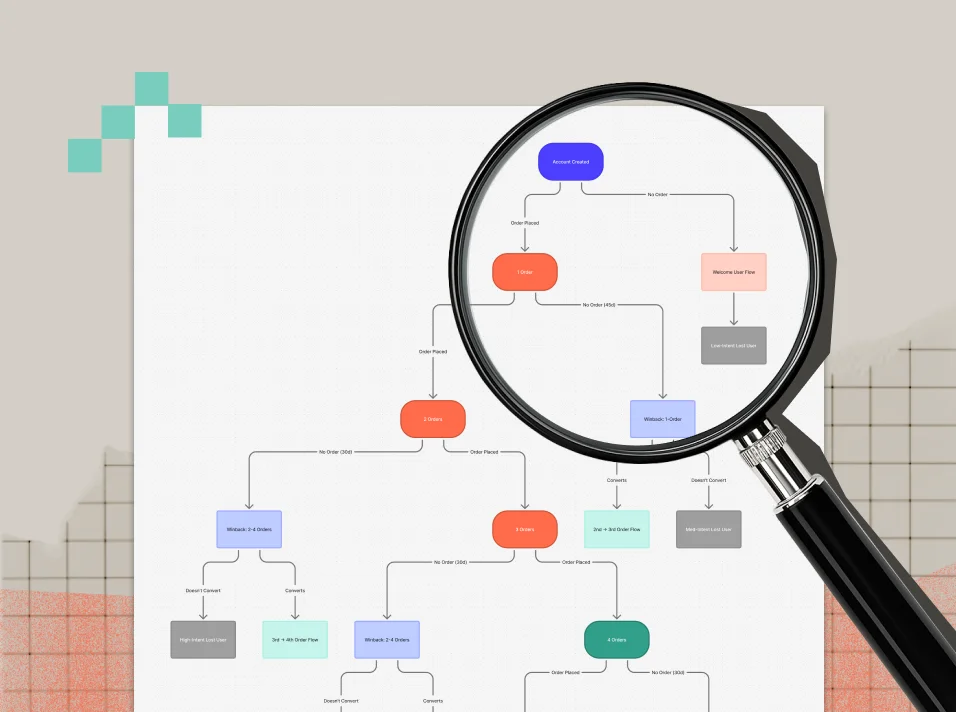
A welcome series and an abandoned cart flow capture a fraction of the available return. The benchmark gap between a two-flow program and a full library is the largest single source of underperformance we see. Build order that works: welcome, checkout abandonment, browse abandonment, post-purchase, replenishment, win-back, sunset.
Segmentation never improves
A flow that treats a first-time buyer and a ten-time buyer identically is leaving most of the personalization lift on the table. Behavioral segmentation is the mechanism, and it is usually a configuration change rather than a new purchase.
Nobody owns maintenance
Flows decay. Products get discontinued, offers change, the tone drifts out of date. Without a scheduled review the benchmark return erodes quietly and the dashboard keeps reporting attributed revenue as though nothing happened.
The measurement is blended
If flow and campaign revenue sit in one number, you cannot see the 5.3% against 41% dynamic in your own account, which means you cannot manage it. Split the reporting first. How to audit your lifecycle marketing program covers the reconciliation, and cohort LTV versus blended LTV makes the same point about lifetime value.
A sane target to work toward
If you want one number to steer by for the next two quarters: get flows to roughly 40% of email revenue, which is where the 183,000-customer benchmark sits, and measure it on contribution margin with a holdout behind it.
Brands materially below that line almost never have a platform problem. They have a build backlog, a segmentation gap or a maintenance gap, and all three are cheaper to fix than a migration. Compare stacks only after the flow mix is right. If you are genuinely at that point, the retention tech stack for $1M to $10M DTC brands and Customer.io versus Braze for subscription brands are the places to start.
The bottom line
Lifecycle marketing automation ROI in 2026 is well evidenced, and the evidence points somewhere specific: 5.3% of sends producing nearly 41% of revenue, at nearly 18 times the revenue per recipient of a broadcast campaign, with nearly half of that revenue coming from first-time buyers.
The return is real. It is also conditional on measuring incrementally rather than by attribution, modelling on margin rather than revenue, and funding maintenance rather than only the build. Get those three right and the benchmark is achievable with the platform you already pay for. Get them wrong and no amount of new tooling will rescue the number.
Sources
- Klaviyo, 2026 Email Marketing Benchmarks by Industry
- McKinsey, The value of getting personalization right or wrong is multiplying
- Fred Reichheld, Bain & Company, Prescription for cutting costs
- Baymard Institute, Cart Abandonment Rate Statistics
- Klaviyo Investor Relations, Q2 2026 results, August 5, 2026
Frequently Asked Questions
What is the ROI of lifecycle marketing automation in 2026?
The best-evidenced figure is the flow-versus-campaign gap. Across more than 183,000 Klaviyo customers, automated flows generate nearly 41 percent of total email revenue from 5.3 percent of sends, with revenue per recipient nearly 18 times higher than broadcast campaigns. A defensible ROI number for your own program comes from measuring incremental revenue with a holdout, converting to contribution margin, and subtracting fully loaded build and maintenance cost.
How do I calculate marketing automation ROI correctly?
Use four lines. First, incremental revenue measured with a holdout rather than attributed revenue, since attribution counts purchases that would have happened anyway. Second, contribution margin rather than top-line revenue. Third, fully loaded cost including build hours, QA, creative, data work and ongoing maintenance, not just the platform fee. Fourth, report payback period in weeks rather than annual ROI, because build cost is front-loaded and revenue is continuous.
Are automated flows better than email campaigns?
They perform very differently on the same accounts. Klaviyo's 2026 benchmarks show flows achieving 5.58 percent click rates against 1.69 percent for campaigns, placed order rates 13 times higher, and revenue per recipient nearly 18 times higher. Campaigns still matter for merchandising, launches and seasonal moments. The point is that the two should be measured and budgeted separately, because a blended email ROI number hides where the return actually comes from.
Why does marketing automation ROI fail to materialise?
Four common causes. The flow library stops at a welcome series and an abandoned cart, capturing a fraction of the available return. Segmentation never improves, so a first-time buyer and a ten-time buyer get identical messages. Nobody owns maintenance, and flows decay as catalogue and offers change. And reporting stays blended, so the flow mix problem is invisible inside the account and therefore unmanageable.
What percentage of email revenue should come from flows?
Roughly 40 percent is the benchmark, based on Klaviyo's analysis of more than 183,000 customers showing flows at nearly 41 percent of email revenue. Brands materially below that line almost never have a platform problem. They have a build backlog, a segmentation gap or a maintenance gap, and all three are cheaper to fix than a migration. Measure the split on contribution margin with a holdout behind it.