Summarize this documentation using AI
Key Takeaways
- Published open rate benchmarks for the same vertical differ by more than 2x. Ecommerce is reported at 15.50% by Brevo and 32.67% by MailerLite. Neither is wrong.
- Apple Mail Privacy Protection explains most of the gap. Brevo publishes both figures from one dataset: ecommerce is 15.50% excluding MPP bot opens and 30.02% including them.
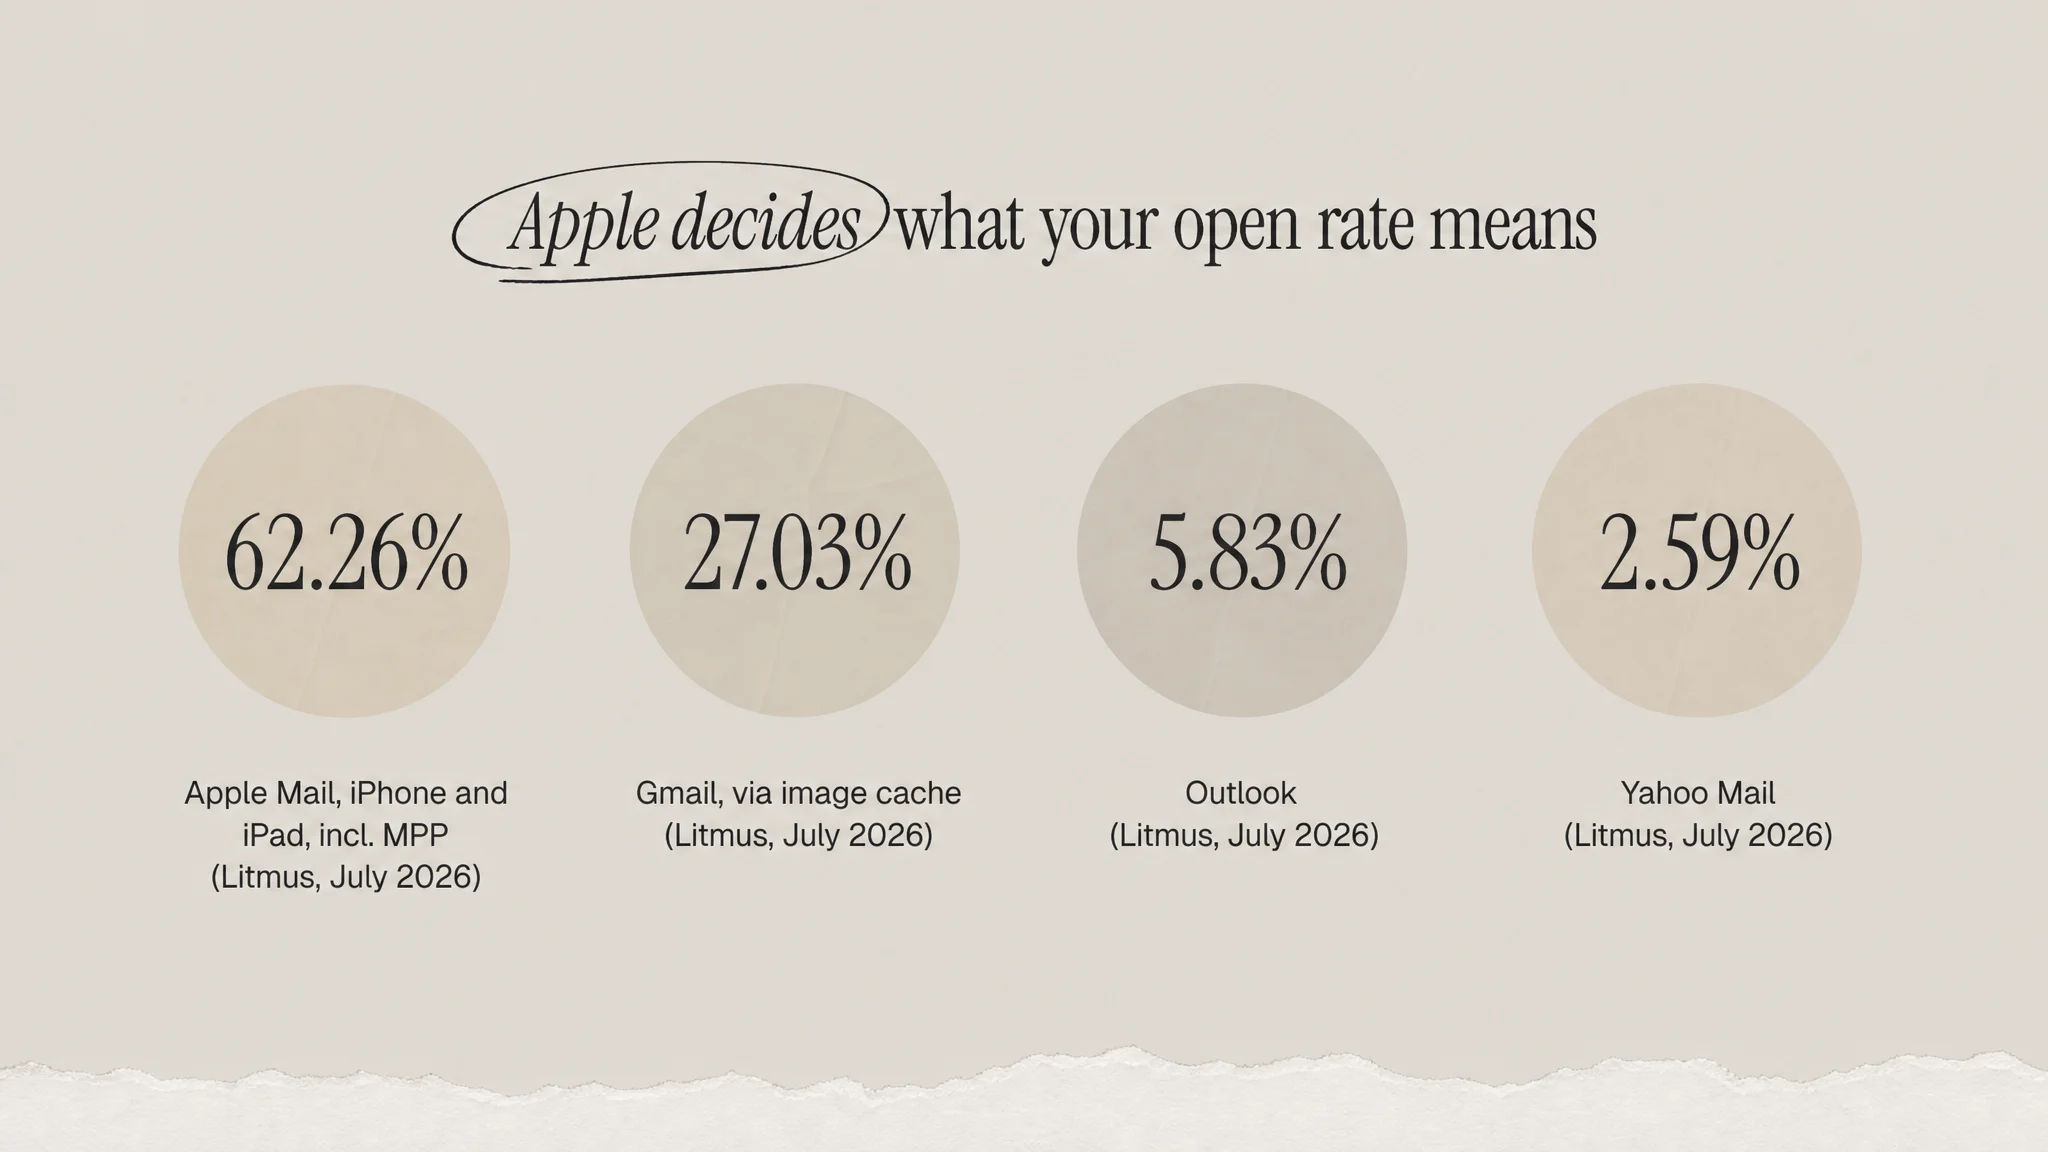
- Litmus measured Apple at 62.26% of all tracked opens in July 2026, with MPP affecting "roughly 55-60% of all email opens."
- Verticals rank consistently even when levels do not. Nonprofit, faith, government and education sit at the top in every dataset. Ecommerce and retail sit near the bottom in every dataset.
- Use open rate for trend and deliverability warnings. Judge relevance on click-to-open and revenue per recipient instead.
If you have ever tried to answer "is our open rate good for our industry?" you will have noticed something odd. One benchmark report says ecommerce email opens at around 15%. Another says 33%. A third says 38%. These are not rounding differences. They are two-and-a-half-fold differences, published in the same year, by credible companies, about the same industry.
This article gives you open rate benchmarks by vertical from seven first-party datasets, keeps each source's numbers separate rather than blending them into a fake consensus, and explains the mechanism that makes them disagree. That mechanism matters more than any single number, because once you understand it you can tell which benchmark your own reporting should be compared against.
Why open rate benchmarks disagree so violently
The short answer is Apple.
Since September 2021, Apple Mail Privacy Protection has pre-loaded email content for users who enable it. In Apple's own words, that content is downloaded "in the background by default, regardless of whether you engage with the email." Apple's privacy documentation is explicit that the feature exists to prevent "email senders from learning information about your Mail activity."
The consequence for measurement is straightforward: the tracking pixel fires whether or not a human ever looked at the message. Every one of those becomes a recorded "open."
How much does that distort things? Litmus, measuring more than one billion opens in July 2026, found Apple accounted for 62.26% of all tracked opens and stated that Apple's MPP "now impact roughly 55-60% of all email opens." Litmus is blunt about what that means: "if an Apple Mail user has Mail Privacy Protection turned on, you will not know if that user opened your email or not."
| Email client | Share of tracked opens (July 2026) |
|---|---|
| Apple (Mail, iPhone, iPad, incl. MPP) | 62.26% |
| Gmail | 27.03% |
| Outlook | 5.83% |
| Yahoo Mail | 2.59% |
Source: Litmus Email Client Market Share, based on over 1 billion opens, July 2026.
So a benchmark provider has a choice: strip suspected MPP opens out, or leave them in. Most leave them in, because most cannot reliably identify them. That single methodological decision roughly doubles the reported number.
The cleanest proof, from one vendor's own table
You do not have to take this on faith or infer it by comparing vendors. Brevo publishes both versions of every figure, side by side, from the same dataset of over 175,000 customers across 2025. Their note is worth quoting: "The standard open rate excludes Apple Mail Privacy Protection (MPP) bot-triggered opens; the MPP-inclusive rate includes them."
| Vertical | Open rate (MPP excluded) | Open rate (MPP included) |
|---|---|---|
| Ecommerce | 15.50% | 30.02% |
| Retail | 16.67% | 32.66% |
| Hospitality and Food Services | 19.01% | 36.69% |
| Healthcare and Wellness | 19.47% | 34.28% |
| Travel, Transportation and Tourism | 19.96% | 32.14% |
| Real Estate and Property Management | 20.32% | 35.53% |
| Information Technology and Software | 20.68% | 30.98% |
| Media | 21.29% | 34.34% |
| Banking and Financial Services | 21.30% | 32.38% |
| Education | 22.25% | 34.19% |
| Insurance | 25.48% | 37.10% |
| Nonprofit and NGO | 27.03% | 40.52% |
| Government and Public Admin | 34.19% | 46.60% |
Source: Brevo email marketing benchmarks, over 175,000 active Brevo customers across 2025, unweighted averages with extreme outliers removed.
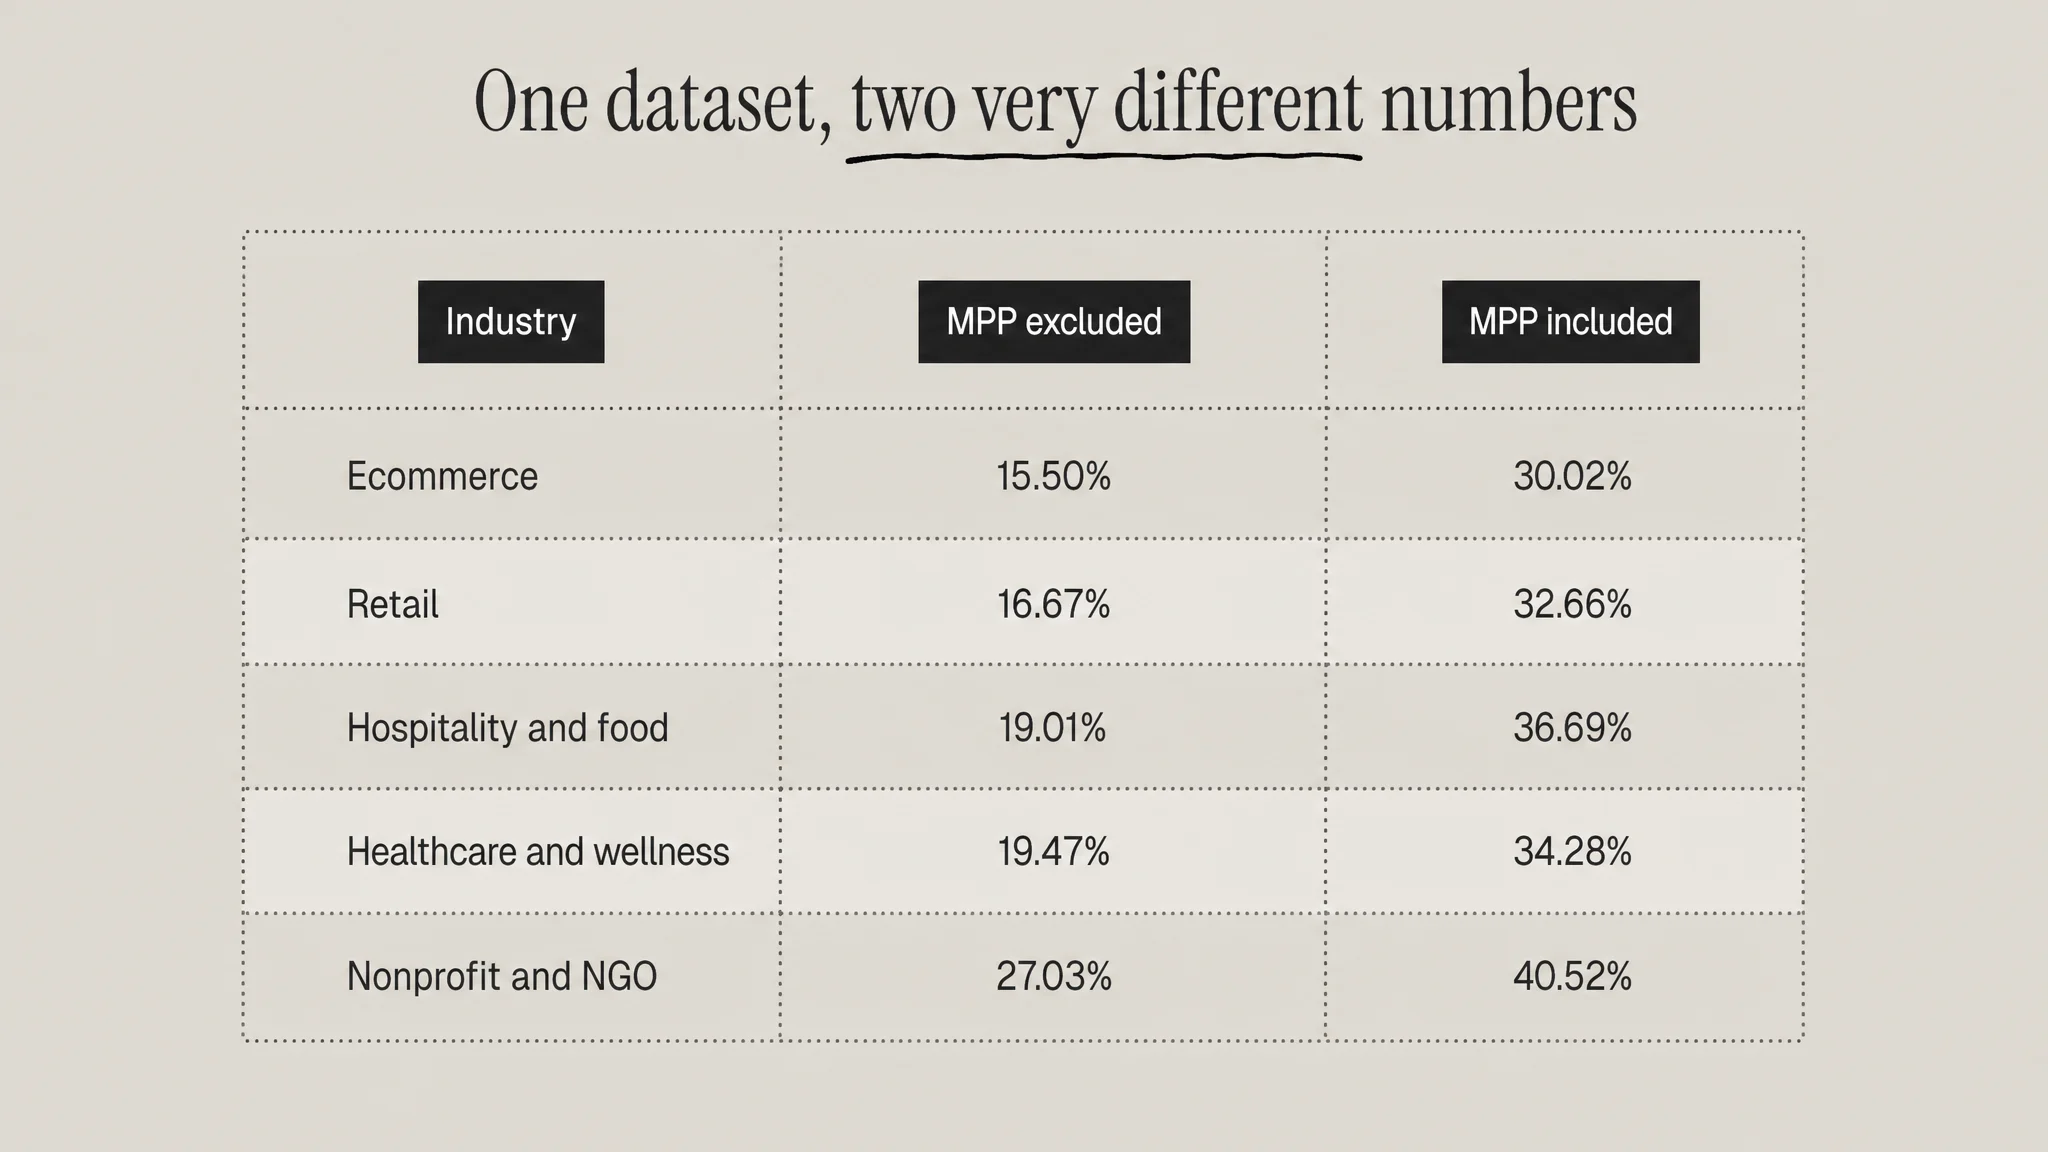
Same brands, same year, same vendor, same table. The only variable is MPP handling, and it nearly doubles every row. If your ESP dashboard shows you 31% and a benchmark page shows 15.5%, you are almost certainly not underperforming by half. You are reading two different metrics with the same name.
Email open rate benchmarks by vertical, by source
Below are the by-vertical figures from the other major first-party datasets. We have deliberately not averaged them. Sample composition, mean versus median, unique versus total opens and minimum list-size filters all vary between these sources, so a blended number would be a fiction.
Klaviyo (2026, ecommerce verticals, MPP inclusive)
Klaviyo analysed data from over 183,000 brands. The all-industry average campaign open rate is 31%, with the top 10% of performers hitting 45.1%. Klaviyo is candid that "Apple 'opens' each email for any user with an enabled Apple MPP, whether or not they actually open the email."
| Vertical | Open rate | Campaign click rate |
|---|---|---|
| Clothing and accessories | 33.1% | 1.83% |
| Home and garden | 32.5% | 1.78% |
| Jewellery | 32.5% | 1.60% |
| Sporting goods | 31.9% | 1.88% |
| Food and beverage | 31.2% | 1.70% |
| Health and beauty | 30.5% | 1.24% |
| Electronics | 29.3% | 1.85% |
| Mass merchant | 28.7% | 1.77% |
Omnisend (2025 data, largest disclosed volume)
Omnisend's dataset covers more than 20 billion campaign emails and 470 million automated sends across 27,000+ brands, with an overall open rate of 30.22%. Their own framing is that "open rate should only be the starting point."
| Vertical | Open rate | Click-to-open |
|---|---|---|
| Travel | 44.84% | 2.70% |
| Arts and Entertainment | 34.15% | 3.95% |
| Apparel | 31.10% | 2.76% |
| Home and Garden | 30.60% | 2.85% |
| Food and Drink | 30.03% | 3.19% |
| Beauty and Fitness | 29.33% | 2.45% |
| Health | 28.64% | 2.77% |
| Consumer Electronics | 25.70% | 3.84% |
| Finance | 20.25% | 4.89% |
Constant Contact (Q1 2026, the only source that publishes its formula)
Drawn from 37,000 of Constant Contact's most successful customers across 20+ industries, January to March 2026. Two caveats you should carry: the sample is explicitly self-selected as "most successful," and the stated formula uses total opens divided by delivered emails, which runs higher than a unique-open basis.
| Vertical | Open rate |
|---|---|
| Faith-Based Organizations | 41.81% |
| Nonprofit Services | 35.28% |
| Education Services | 33.18% |
| Dining and Food Services | 31.09% |
| Health and Wellness Services | 30.68% |
| Real Estate | 29.85% |
| Travel and Tourism | 28.21% |
| Retail Services | 27.27% |
| Financial Services | 26.89% |
| Technology Services | 26.51% |
MailerLite, ActiveCampaign and the older sets
MailerLite reports medians rather than means across 3.6 million campaigns from 181,000 accounts, December 2024 to November 2025. Medians resist outlier skew, which is part of why its figures sit high: religion 55.71%, non-profit 52.38%, government 48.52%, health and fitness 47.81%, retail 37.47%, e-commerce 32.67%. MailerLite states plainly that "real open rates are lower than the metrics you see in your dashboard" because of MPP.
ActiveCampaign, covering all customer campaigns from January to December 2025, reports an overall 39.26% with media and publishing at 43.16%, healthcare at 41.48% and e-commerce/retail at 35.66%. It does not disclose sample size or address MPP.
Two widely cited sets are now dated and should be labelled as such if you use them: Mailchimp's benchmarks were last updated in December 2023 (all users 35.63%, ecommerce 29.81%), and GetResponse's report covers 4.4 billion messages sent in 2023 and counts non-unique engagement, which inflates both open rate and click rate relative to unique-based sources.
What is a good open rate for your vertical?
Read the table that matches your measurement, not the one with the friendliest number.
- If your reporting includes Apple MPP opens (true for nearly every ESP dashboard by default), compare against the MPP-inclusive column: roughly 30% to 33% for ecommerce and retail, 34% to 37% for healthcare and hospitality, 40%+ for nonprofit and government.
- If your ESP filters MPP opens, compare against Brevo's excluded column: roughly 15% to 17% for ecommerce and retail, 19% to 22% for healthcare, travel, media and education.
- Either way, the ranking is stable. Mission-driven and information-led senders (faith, nonprofit, government, education, media) beat commercial senders in every dataset. Ecommerce and retail sit at or near the bottom of every dataset. That consistency is more trustworthy than any level.
The metrics to judge yourself on instead
Open rate survives as a diagnostic, not a goal. A sudden drop still signals a deliverability problem worth investigating, and the trend line for your own list is meaningful even when the absolute level is not. But for relevance, use click-to-open by segment, and for commercial performance use revenue per email. Both are immune to MPP.
The other reason not to chase open rate: the gap between automated and broadcast email dwarfs any vertical difference. Our ecommerce email benchmarks breakdown covers the flows-versus-campaigns split in detail, and if your automation coverage is thin, the flows worth building first will move revenue further than a subject line test. Getting the triggers right starts with event-triggered email and behavioural segmentation.
Protect the number before you optimise it
Every benchmark above assumes your mail reaches the inbox. Since 2024, Gmail has required bulk senders, defined as "any email sender that sends close to 5,000 messages or more to personal Gmail accounts within a 24-hour period", to authenticate with SPF and DKIM, publish a DMARC policy with domain alignment, offer one-click unsubscribe per RFC 8058, and keep user-reported spam below 0.10%, never reaching 0.30%.
Yahoo's sender best practices mirror this: implement both SPF and DKIM, publish a valid DMARC policy, support one-click unsubscribe, honour unsubscribes within two days, and keep spam complaints below 0.3% measured on mail delivered to the inbox.
If any of that is unresolved, your open rate is a deliverability readout rather than an engagement one. Start with email deliverability, then put a sunset flow in place so disengaged addresses stop dragging your reputation down, and a win-back flow to give them one honest chance first.
The bottom line
Open rate benchmarks by vertical are useful once you stop treating them as a single truth. Pick the dataset whose MPP handling matches your own reporting, compare within it, and watch your own trend more closely than the industry line. Then move your actual targets to click-to-open and revenue per recipient, which measure whether the email worked rather than whether a server fetched an image.
Sources
- Apple, Mail Privacy Protection privacy documentation
- Litmus, Email Client Market Share (1 billion+ opens, July 2026)
- Brevo, Email marketing benchmarks (175,000+ customers, 2025)
- Klaviyo, Email marketing benchmarks (183,000+ brands, 2026)
- Omnisend, Email marketing benchmarks (20 billion+ emails, 27,000+ brands, 2025)
- Constant Contact, What is a good open rate for email (37,000 customers, Q1 2026)
- MailerLite, Industry benchmarks (3.6 million campaigns, Dec 2024 to Nov 2025, medians)
- ActiveCampaign, Email benchmarks (2025 campaigns)
- Mailchimp, Email marketing benchmarks (last updated December 2023)
- GetResponse, Email marketing benchmarks (4.4 billion messages, 2023)
- Google, Email sender guidelines FAQ
- Yahoo, Sender best practices
Frequently Asked Questions
What is a good email open rate by industry in 2026?
It depends on whether your reporting counts Apple bot opens. On an MPP-inclusive basis, expect roughly 30% to 33% for ecommerce and retail, 34% to 37% for healthcare and hospitality, and above 40% for nonprofit and government. On an MPP-excluded basis, the same verticals run about 15% to 17% and 19% to 22% respectively. Match the basis before you compare.
Why do email open rate benchmarks differ by more than 2x between sources?
Apple Mail Privacy Protection. Since 2021 it pre-loads email content whether or not anyone reads the message, so the tracking pixel fires anyway. Brevo publishes both versions from one dataset: ecommerce is 15.50% excluding MPP opens and 30.02% including them. Most providers include them, because most cannot reliably identify which opens were machine-generated.
How much does Apple Mail Privacy Protection inflate open rates?
Litmus measured Apple at 62.26% of all tracked opens in July 2026 and reported that MPP affects roughly 55 to 60% of all email opens. Brevo's side-by-side figures show the practical effect: reported open rates roughly double when MPP opens are counted. Apple does not publish an inflation figure itself, so treat any number attributed directly to Apple with suspicion.
Which industries have the highest email open rates?
Mission-driven and information-led senders lead in every dataset. Constant Contact puts faith-based organisations at 41.81% and nonprofit services at 35.28%. MailerLite's medians show religion at 55.71%, non-profit at 52.38% and government at 48.52%. Brevo ranks government and public administration highest at 34.19% MPP-excluded. Ecommerce and retail sit near the bottom throughout.
If open rate is unreliable, what should you measure instead?
Click-to-open rate by segment for relevance, and revenue per email for commercial performance. Both are immune to MPP inflation. Keep open rate as a diagnostic, since a sudden drop still signals a deliverability problem worth investigating. The larger opportunity is usually the gap between automated flows and broadcast campaigns rather than any vertical difference.