Summarize this documentation using AI
Key Takeaways
- Repeat purchase rate is the share of customers who placed two or more orders within a defined window, divided by all customers who ordered in that window.
- It is not the same as customer retention rate or purchase frequency. It counts people who came back, not how often they came back or how many survived a period.
- The whole numerator is made of second purchases, so the conversion from first to second order is the main lever.
- Published guidance clusters around 20% to 40%, but category, price point and window length move the number more than marketing does.
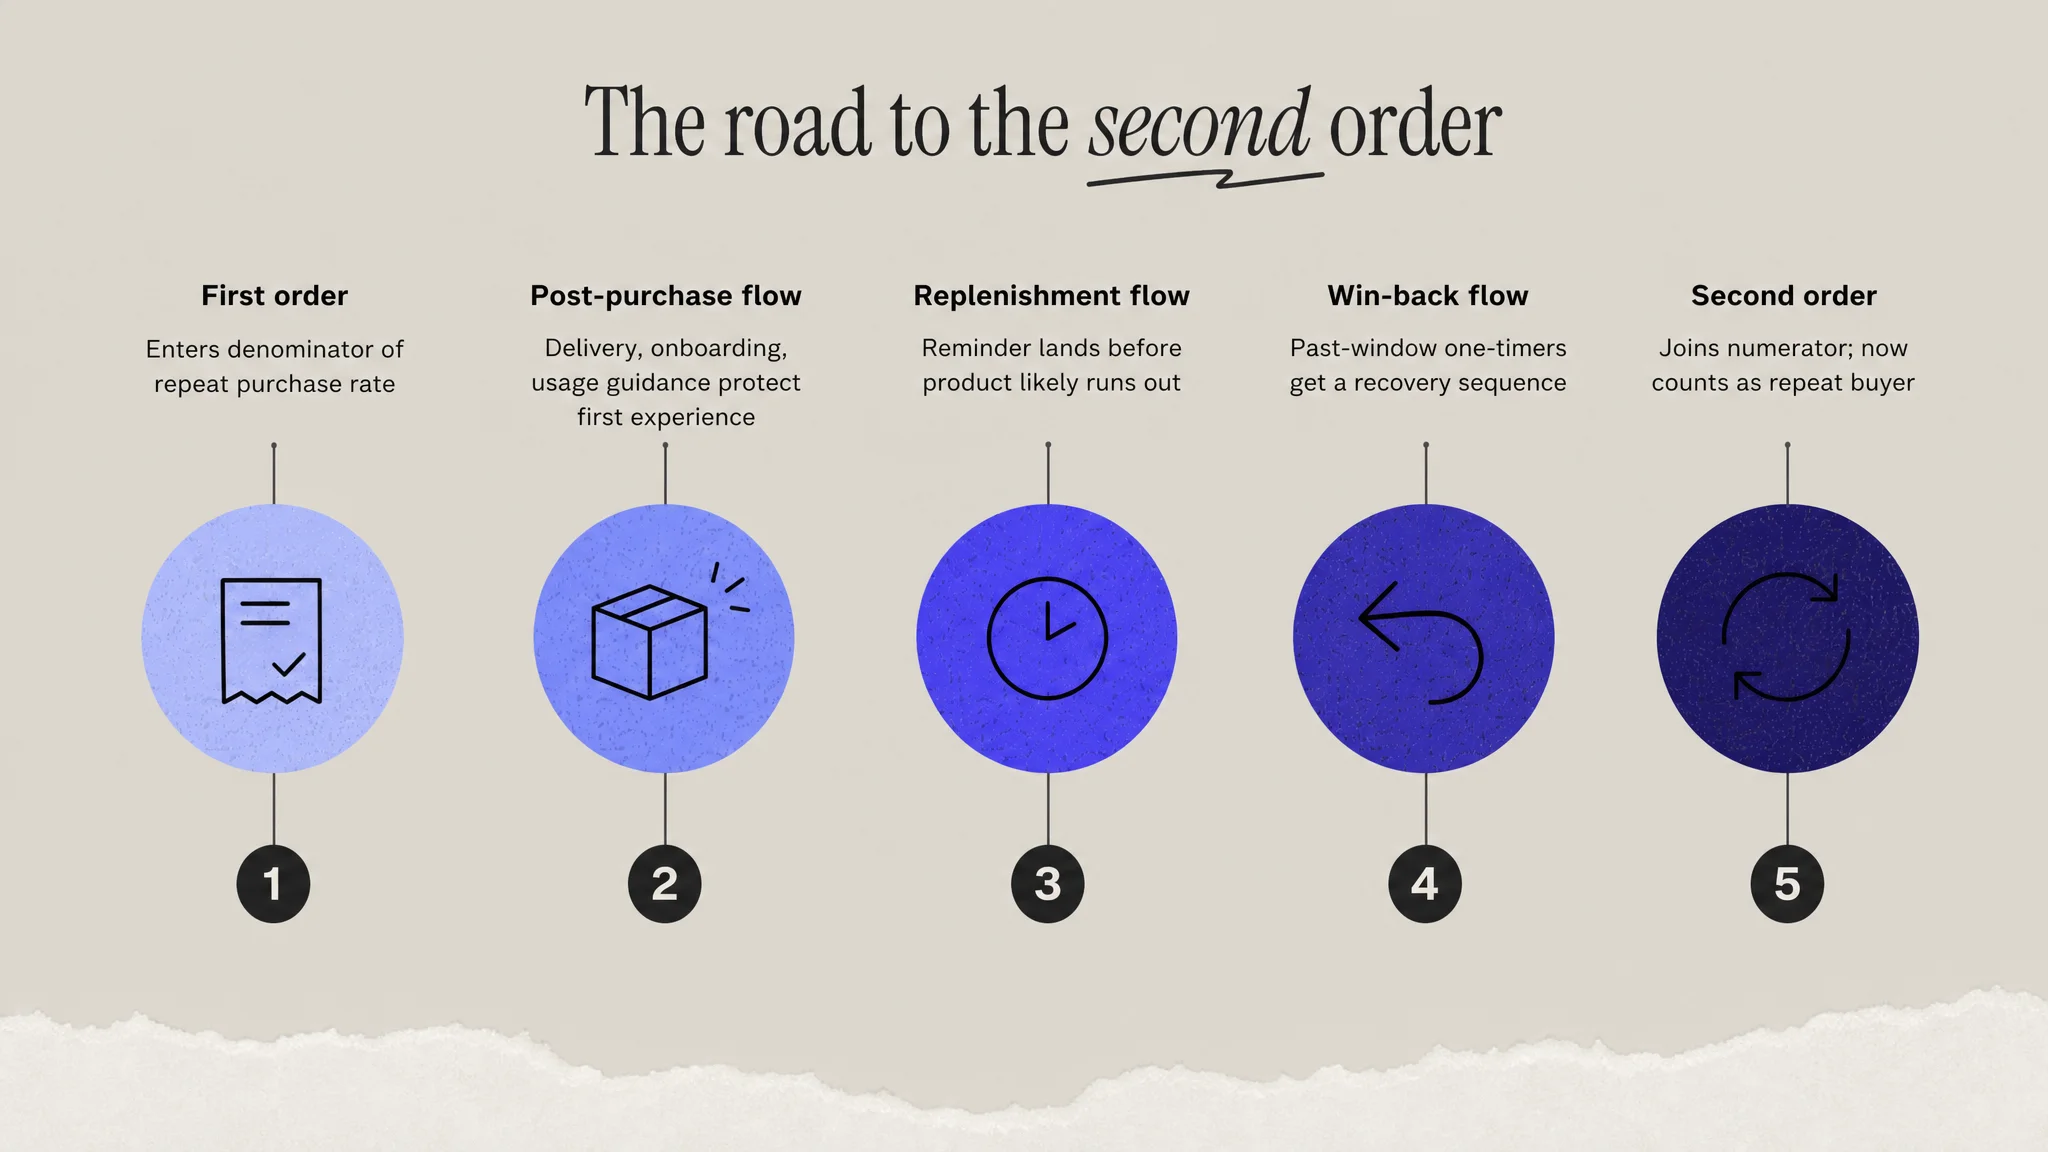
- Post-purchase, replenishment and win-back flows each act on a different part of the gap between first and second order.
Repeat purchase rate (RPR) is the percentage of customers who have placed more than one order with a brand during a set period of time. It answers one question: of everyone who bought, how many came back at least once?
What repeat purchase rate measures
Repeat purchase rate splits your customer base into two groups: one-time buyers and repeat buyers. A customer with two orders and a customer with twenty orders both count once, as repeat buyers. That is the point of the metric. It tells you how broad your returning base is, not how deep it goes.
Klaviyo defines it as the percentage of customers who have bought from you more than once within a specific period of time. Shopify uses the same construction in its own guidance, with the option to calculate the rate of customers who have purchased a specific number of times.
How to calculate repeat purchase rate
Repeat purchase rate = (customers with 2+ orders in the window / total customers with 1+ order in the window) x 100
An illustrative example: over the last 12 months, 10,000 customers placed at least one order. Of those, 2,600 placed two or more. Repeat purchase rate is 2,600 / 10,000, or 26%.
Three decisions shape the result:
- The window. Twelve months is the common default. A 90-day window in a category people buy twice a year will make a healthy brand look broken. Base it on your median time between first and second order.
- Which orders count. Exclude cancelled, fully refunded and zero-value orders. Decide whether subscription renewals count, and say so in the dashboard.
- Customer identity. Guest checkouts with different emails inflate the denominator and deflate the rate. Deduplicate before you trust the number.
Note that Shopify's built-in "returning customer rate" is a related but different calculation. Its analytics reference defines it as returning customers divided by all customers who placed orders in the period, where a returning customer is anyone who has purchased before, even if that earlier order fell outside the period. Expect it to read differently from a strict in-window RPR.
Repeat purchase rate vs retention rate vs purchase frequency
These three are often used interchangeably. They answer different questions.
| Metric | Question it answers | Typical formula |
|---|---|---|
| Repeat purchase rate | What share of buyers came back at least once? | Customers with 2+ orders / all customers, in one window |
| Customer retention rate | What share of customers from period A are still active in period B? | (Customers at end minus new customers) / customers at start |
| Purchase frequency | How many orders does the average customer place? | Total orders / unique customers, in one window |
Retention rate is period-over-period and cohort-shaped, which is why it is best read on a retention curve. Purchase frequency is an average, so a small group of heavy buyers can lift it while most customers never return. Repeat purchase rate is the guard against that distortion: if frequency rises but RPR is flat, your loyal core is buying more while the one-time problem is unchanged.
Read alongside cohort analysis, they show whether growth comes from more people returning or the same people returning more often.
Why the second purchase is the lever
Every customer in the numerator got there by placing a second order. There is no other route. That makes first-to-second-order conversion the mechanism behind the metric, and the period between those two orders the most valuable stretch in the customer relationship.
The reason this matters commercially is that repeat customers compound. Bain research cited by Shopify found that a 5% increase in retention correlates with at least a 25% increase in profit, and that after ten purchases shoppers refer as many as 50% more people than one-time buyers. None of those later purchases or referrals happen without the second order first.
In practice, second-purchase conversion breaks into three questions you can measure separately:
- Did the first order go well? Delivery, product experience and support shape whether a second order is even considered.
- Did we reach them at the right time? The median gap between first and second order in your own data sets when the ask should land.
- Did we give them a reason? A relevant next product, a refill, or a recovery message if they drifted.
Repeat purchase rate benchmarks
Benchmarks for this metric vary because providers use different windows and customer definitions. Treat the numbers below as orientation, not targets.
- Klaviyo: a good repeat purchase rate is typically around 20% to 30%, running higher for affordable or consumable products and lower for luxury and high-value goods.
- Shopify: its analytics reference notes that most stores display a returning customer rate of 20% to 40%.
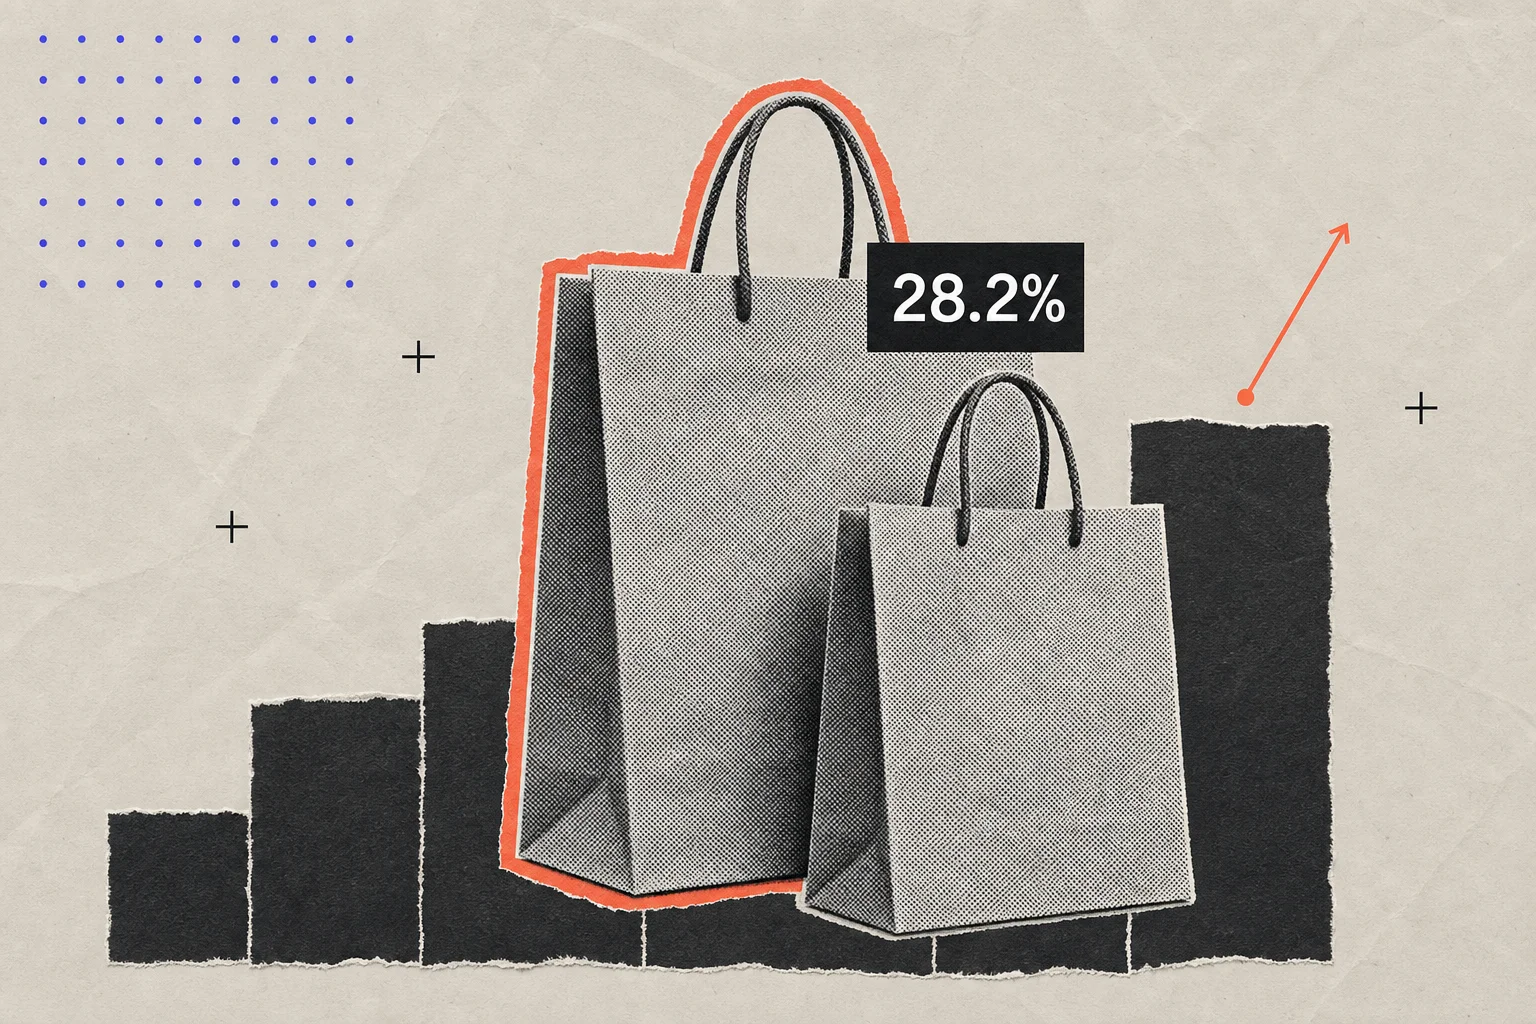
- Metrilo: across consenting ecommerce clients using its retention tools, the average repeat purchase rate was 28.2%.
Metrilo's data also breaks the average out by category:
| Category | Repeat purchase rate |
|---|---|
| Tea | 20.9% |
| Meal delivery | 29.0% |
| Supplements | 29.1% |
| High-performance sports clothing and gadgets | 33.0% |
| CBD products | 36.2% |
Two caveats. First, Metrilo's sample is its own customer base, so it skews toward brands already investing in retention. Second, the spread between categories is narrower than the spread you will see inside any one category between brands with and without working lifecycle programs. For wider context, see our ecommerce retention rate benchmarks.
How lifecycle flows move repeat purchase rate
Each core flow acts on a different failure point between first and second order.
Post-purchase flows: protect the first experience
The post-purchase sequence covers order confirmation, shipping, delivery, usage guidance and the first cross-sell. Its job is to make the first order feel like the start of a relationship rather than a closed transaction. Save the next-product recommendation for after delivery. Post-purchase experience optimization covers the sequence in detail.
Replenishment flows: match the natural cycle
For consumables, the second order is largely a timing problem. A replenishment flow triggers a reminder shortly before a product is likely to run out, based on pack size or observed reorder intervals. Klaviyo's predictive analytics can estimate an expected date of next order for each customer, but it requires at least 500 customers with valid orders, 180 days of order history and some customers with three or more orders. Klaviyo itself recommends classic replenishment flows where the product cycle is already known.
Win-back flows: recover the drift
Customers who pass your median second-order window without buying are not lost, but each week lowers the odds. A win-back flow targets one-time buyers specifically, starting with relevance and social proof before any discount. Prioritise them with RFM analysis so recent, higher-value first-time buyers get attention first.
Common mistakes and limits
- Comparing windows that do not match. A 12-month RPR and a 90-day RPR are different metrics. Fix the window and keep it.
- Reading a growth spike as a retention drop. A large acquisition push adds many first-time buyers to the denominator who have not had time to return. Read RPR by acquisition cohort, not only blended.
- Counting subscriptions as choice. Auto-renewals mechanically create repeat orders. Report subscription and one-off customers separately.
- Ignoring depth. RPR treats a two-order customer and a ten-order customer the same. Pair it with purchase frequency and revenue per customer.
- Buying it with discounts. A heavy second-order coupon can lift the rate while training customers to wait for offers. Watch margin on second orders, not just volume.
Where it fits in the lifecycle program
Repeat purchase rate is a breadth indicator. It sits between acquisition metrics, which tell you how many first orders you are buying, and value metrics such as customer LTV, which tell you what those customers are worth over time. When RPR rises, LTV usually follows, because more customers enter the part of the relationship where most lifetime revenue is earned.
Measure it on a fixed window, read it by cohort, and manage it through the first-to-second-order gap. That is where post-purchase, replenishment and win-back flows earn their keep.
Sources
- Klaviyo, What is a good repeat purchase rate?
- Shopify Help Center, Analytics fields reference (returning customer rate)
- Shopify, What are repeat customers and how to increase them (citing Bain & Company)
- Metrilo, Repeat purchase rate benchmarks by industry
- Klaviyo Help Center, Understanding Klaviyo's predictive analytics
Frequently Asked Questions
What is a good repeat purchase rate for an ecommerce store?
Klaviyo puts a good repeat purchase rate at roughly 20% to 30%, and Shopify notes most stores show a returning customer rate between 20% and 40%. Consumable and lower-priced products tend to sit at the top of that range, while furniture, luxury and other high-ticket goods sit lower. Compare yourself against your own trend on a fixed window before comparing against other brands, since providers calculate the figure differently.
Is repeat purchase rate the same as customer retention rate?
No. Repeat purchase rate looks at one window and asks what share of buyers ordered at least twice. Customer retention rate compares two periods and asks what share of existing customers stayed active from one to the next, excluding newly acquired customers. A brand can post a decent repeat purchase rate while losing customers period over period, so tracking both gives a fuller picture.
What time window should I use to calculate repeat purchase rate?
Twelve months is the most common default because it smooths seasonality. The better rule is to set the window to cover at least two typical gaps between a first and second order in your own data. A coffee brand reordering monthly can use a shorter window; a mattress or furniture brand needs a much longer one, or the rate will understate real loyalty.
How can I increase repeat purchase rate quickly?
Start with the gap between first and second order. Make sure a post-purchase sequence is live, add a replenishment reminder for any consumable product timed to its usage cycle, and run a win-back sequence aimed specifically at one-time buyers who have passed your typical reorder window. These three flows usually deliver faster gains than new loyalty schemes or broad discount campaigns.
Why did my repeat purchase rate drop after a big sales month?
Large acquisition pushes add many first-time buyers to the denominator who have not yet had time to place a second order, which pulls the blended rate down even if loyalty has not changed. Split the metric by acquisition cohort and compare each cohort at the same age. If older cohorts are steady, the drop is a mix effect rather than a retention problem.
-thumbnail.webp)