
Summarize this documentation using AI
Cohort analysis is a method of grouping customers by a shared starting characteristic, usually the month they were acquired, and tracking how each group behaves over time, so you can see whether retention and revenue are genuinely improving instead of being hidden by blended averages. It is the single most honest way to answer the question every operator asks: are our newer customers actually better than our older ones? A blended average can rise even as each new cohort retains worse, because a handful of loyal long-tenured customers flatter the number. Cohorts strip that illusion away, which is why they are the backbone of cohort LTV rather than blended LTV.
Key Takeaways
- Cohorts group by a shared start. Usually acquisition month, so each group's behavior can be tracked over its own lifetime.
- Blended averages lie; cohorts do not. A rising blended LTV can mask newer customers retaining worse; cohort analysis reveals it.
- The retention curve is the output. Plotting each cohort's active rate over time shows where and when customers drop off.
- It guides investment. Cohorts tell you whether a change (new onboarding, new flow) actually improved retention for the customers who came after it.
- It is the lens for lifecycle revenue. Measuring lifecycle revenue by cohort is how you see the business as it really is.
What Cohort Analysis Is
Cohort analysis takes a flat customer list and slices it into groups that share a starting point, most commonly the month they made their first purchase. Each cohort is then tracked on its own timeline: how many are still active in month one, month three, month six, and so on. The result is a view of behavior over the customer lifetime rather than a single snapshot. This is the analytical foundation under lifecycle marketing, because it lets you see the shape of retention, not just its current level.
Why Blended Averages Mislead
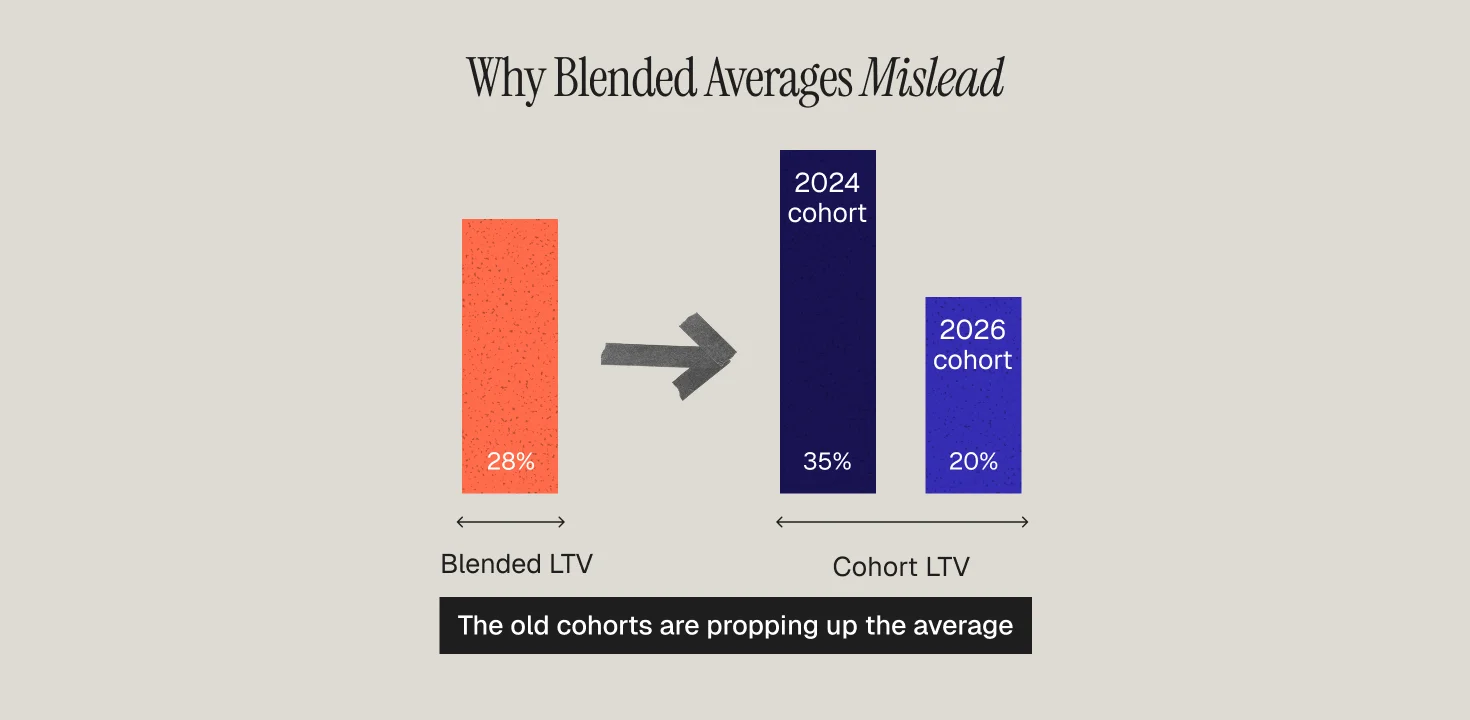
The reason cohort analysis exists is that blended metrics hide decay. Imagine a brand whose blended repeat-purchase rate looks stable at 28%. Underneath, its 2024 cohorts might retain at 35% while its 2026 cohorts retain at 20%, with the old cohorts propping up the average. A blended number would call this business healthy right up until the old customers age out and the bottom falls out. Only cohort LTV versus blended LTV exposes the trend in time to act. Benchmarking each cohort against your category, using data like Propel's retention rates by industry, turns the analysis from interesting into decision-grade.
How to Read a Retention Curve
A cohort retention curve plots the percentage of each cohort still active against time since acquisition. Healthy curves flatten (they reach a stable core of loyal customers rather than declining to zero), and improving curves sit higher for newer cohorts than older ones. The two things to look for are the slope in the first 90 days (steep early drop-off signals an activation problem) and whether the curve flattens (a flattening curve means you have a durable base). Reading the curve is how you turn a table of numbers into a diagnosis.
Acquisition vs Behavioral Cohorts
There are two main ways to cut cohorts. Acquisition cohorts group customers by when they joined, which is best for measuring whether the business is improving over time. Behavioral cohorts group customers by what they did (first product bought, channel acquired, whether they used a specific feature), which is best for understanding which behaviors predict retention. Pairing the two with RFM analysis tells you not just that retention is changing, but which customer behaviors are driving it.
How to Use Cohort Analysis
Use it to answer causal questions. Did the new welcome series improve retention? Compare the cohorts before and after you launched it. Is a particular acquisition channel bringing in customers who churn fast? Cohort them by channel. Which is the highest-leverage moment to intervene? Find where the curve drops steepest. Cohort analysis is the measurement layer that keeps a lifecycle revenue program honest, and it is one of the retention KPIs every operator should track.
Frequently Asked Questions
What is cohort analysis?
A method of grouping customers by a shared starting characteristic (usually acquisition month) and tracking each group's behavior over time, so you can measure retention and revenue trends that blended averages hide.
Why is cohort analysis better than a blended average?
Because a blended average can rise while newer customers retain worse. Cohorts isolate each group so decay shows up while you can still act on it.
What is a cohort retention curve?
A chart plotting the share of each cohort still active over time since they joined. A healthy curve flattens to a loyal core; an improving one sits higher for newer cohorts.
What is the difference between acquisition and behavioral cohorts?
Acquisition cohorts group by when customers joined (best for tracking improvement over time); behavioral cohorts group by what they did (best for finding which behaviors predict retention).
How does cohort analysis relate to LTV?
LTV measured by cohort is far more accurate than a blended figure, because it reflects how each group actually retains and spends rather than an average distorted by tenure.

-thumbnail.webp)

.png)