Summarize this documentation using AI
Key Takeaways
- Time between purchases is the number of days between a customer's consecutive orders, summarised across customers as a median or average.
- Use the median, not the mean. A handful of customers who return after a year will drag an average well past what a typical customer does.
- The gap from first to second order is usually different from the gap between later orders, so measure them separately.
- It is the clock your lifecycle program runs on: replenishment reminders, nudges, win-back triggers and your definition of "lapsed" should all be set relative to it.
- Klaviyo's predictive analytics shows an average time between orders and an expected date of next order per profile, once your account meets its data thresholds.
Time between purchases is the typical number of days that pass between one order and the next for the same customer, usually reported as the median or average gap across your customer base. It is also called the purchase interval, inter-purchase time or days between orders.
Most brands know their repeat purchase rate. Fewer know how long customers take to come back, which decides when every retention message should land.
What time between purchases measures
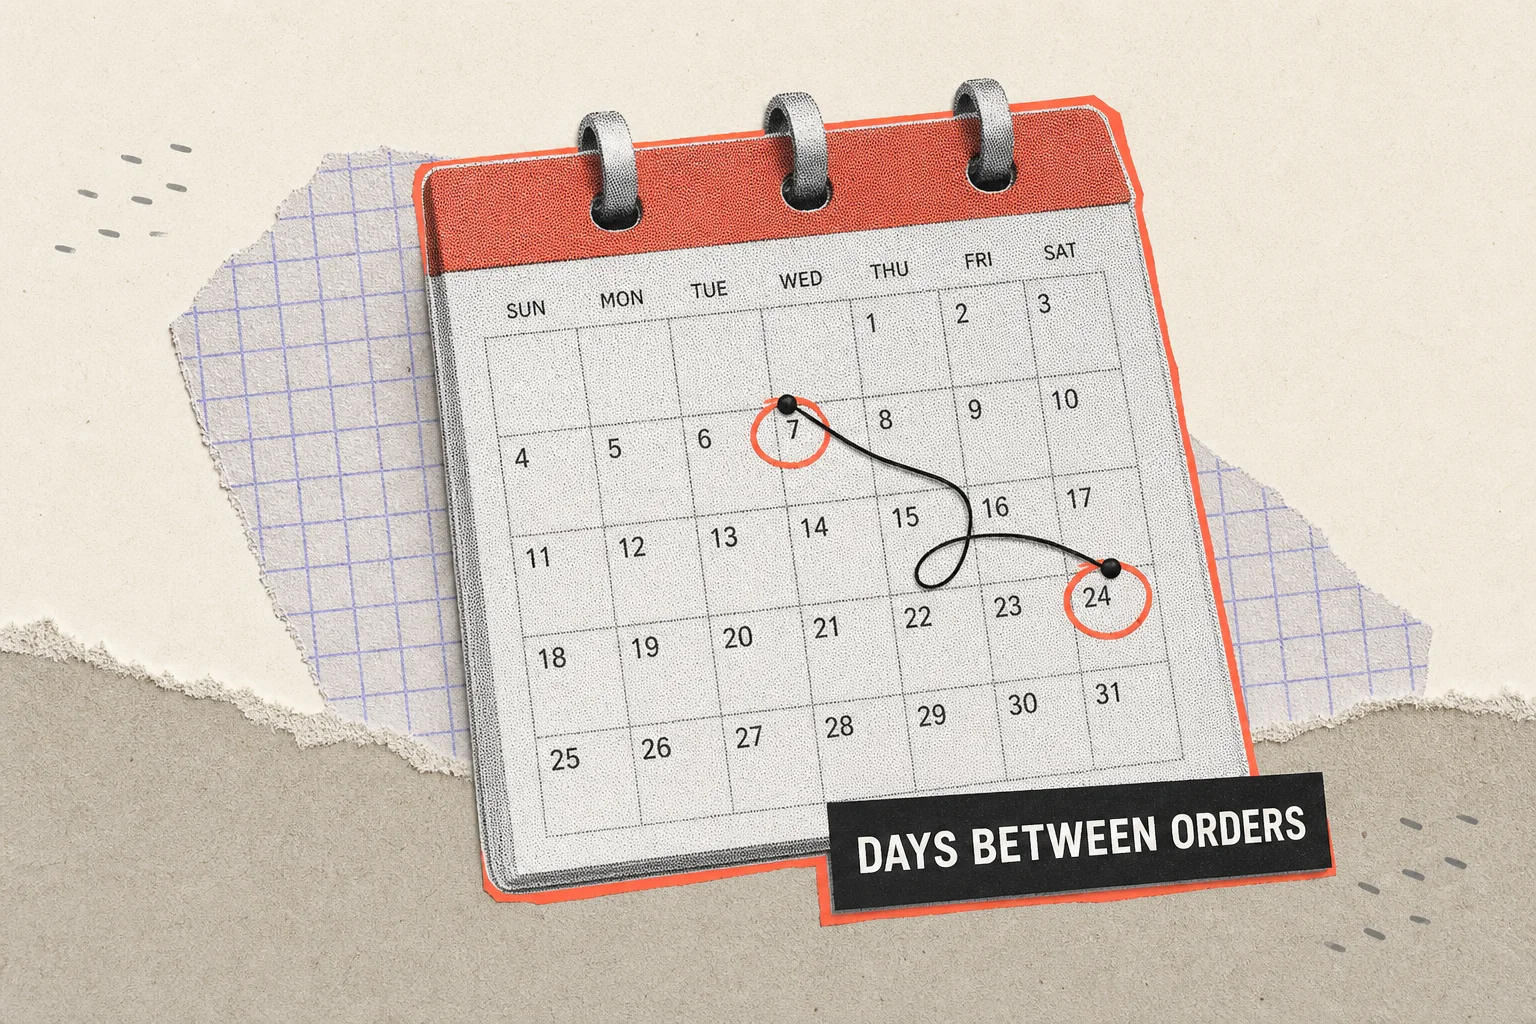
For a single customer, the calculation is simple: take each pair of consecutive orders and count the days between them. A customer who ordered on 1 March, 31 March and 5 May has two intervals, 30 days and 35 days. Klaviyo defines its version of the metric in exactly these terms: "the average number of days between each of a customer's orders."
For the business, you summarise those intervals across customers. That summary is what people mean when they say "our customers reorder every five weeks." It only exists for customers with at least two orders, which is the first thing to remember when you read it.
How to calculate it
- Pull order history. Customer ID and order date for every non-cancelled, non-refunded order over a window long enough to contain several cycles.
- Sort and difference. For each customer, sort orders by date and compute days between each order and the one before it.
- Tag each interval. Label whether it is the first-to-second gap, the second-to-third gap, and so on, plus the product or category of the later order.
- Summarise. Take the median of the intervals, then look at the spread (the 25th and 75th percentiles) rather than a single number.
The formula for one customer is: interval = date of order n minus date of order n-1. The business-level metric is the median of all those intervals within the segment you care about.
Median over mean
Purchase intervals are skewed. Most repeat customers cluster around a typical gap, while a long tail returns after six, nine or twelve months. Those tail customers inflate the mean. As an illustrative example, if nine customers reorder at 30 days and one returns at 300 days, the mean is 57 days while the median stays at 30. Building a replenishment reminder on 57 days would arrive weeks after most customers already needed the product.
First-to-second gap vs steady-state gap
The interval between first and second order behaves differently from the interval between later orders. New customers are still deciding whether the product works for them, and many never return at all. Customers on their fourth order have settled into a rhythm. Report the first-to-second gap on its own, because it sets the timing of your post-purchase and second-purchase program, and report the steady-state gap (orders three onward) separately, because it sets replenishment and loyalty timing. Cohort analysis is the cleanest way to see how the first gap shifts by acquisition month or channel.
By product and category
A store selling a 30-day supplement and a winter jacket has at least two purchase intervals, and the blended figure describes neither. Calculate the interval for each consumable product or category, keyed to what was bought in the earlier order. That is the number a replenishment flow needs.
Benchmarks: why your own data beats anyone else's
There is no reliable cross-industry benchmark for time between purchases. The interval is driven by consumption rate, pack size and price point, so it is specific to your catalogue. Treat any external number as a sanity check at most.
What does exist is guidance on how much data you need for a trustworthy figure. Klaviyo's predictive analytics, which computes the interval and a predicted next order date, only switches on when an account has at least 500 customers who have placed an order, at least 180 days of order history with orders in the last 30 days, and at least some customers with three or more orders. That is a useful floor for your own analysis too: below it, the median moves around too much to schedule flows against.
For consumables, product logic gives you a starting point before you have data. Klaviyo's replenishment guide uses the example of a 30-day supply supplement and suggests a first reminder around 25 days after purchase, then advises adjusting "based on your customers' established buying cycles."
Why it matters: it sets the clock for your flows
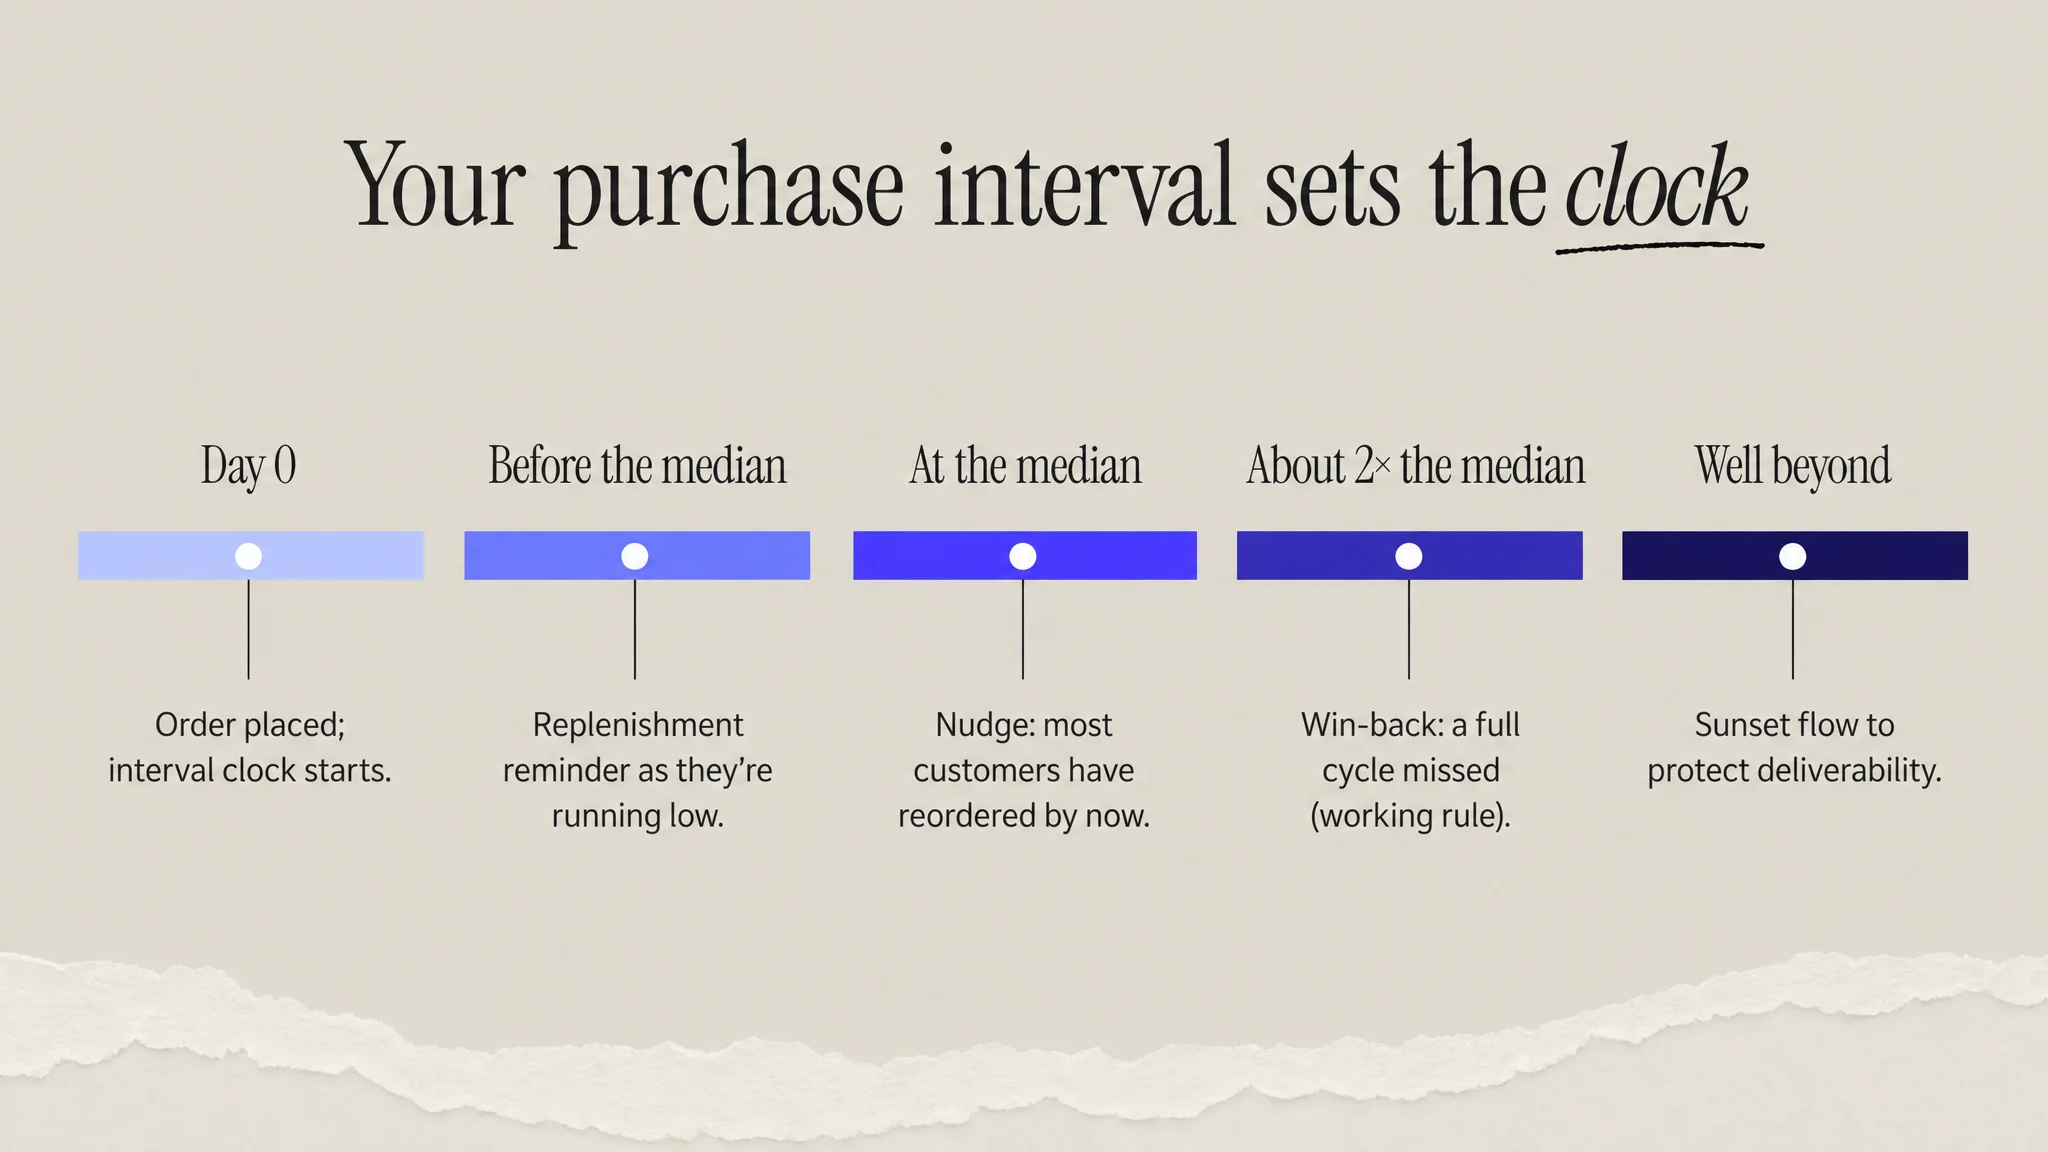
Time between purchases converts "send a reminder" into "send it on day X." Each stage of a post-purchase program can be pinned to it.
- Replenishment reminder. Before the median interval, so it arrives while the customer is running low, not after they have bought elsewhere.
- Nudge. At the median. Customers who have not reordered by the point most people do are drifting from their own cycle.
- Win-back trigger. At a multiple of the median. A practical working rule is around two times. At that point the customer has missed a full cycle and a win-back email flow is justified.
- Sunset. Well beyond that, when sends cost deliverability more than they recover. A sunset flow handles the exit.
Defining "lapsed" relative to your own cycle
A fixed 90-day or 180-day lapsed rule is the most common mistake this metric fixes. If your customers reorder every 20 days, someone silent for 60 days has missed three cycles and is well into churn. If they reorder every 150 days, someone silent for 90 days is perfectly healthy. Define lapsed as a multiple of your median interval, per category, and your RFM analysis and churn reporting become comparable across products.
Klaviyo's expected date of next order
Klaviyo exposes two related fields in the Predictive analytics section of each profile, on the Metrics and insights tab: average time between orders and expected date of next order. According to Klaviyo's help documentation, the prediction "takes into account the specific customer's order behavior and the order behavior of all of your customers," and the underlying model is retrained at least once a week.
Two details matter for how you use it. First, for one-time purchasers Klaviyo says it calculates the expected date "using data across all of your customers," so for a first-time buyer the prediction is essentially a store-level estimate, not a personal one. Second, Klaviyo itself suggests that brands with a high share of repeat buyers may want to use the feature mainly for customers who have purchased once, to time the push toward a second order.
For multi-category catalogues, check the prediction against your own per-category intervals before you hand it control of timing. Klaviyo's model sits in the same family of thinking as academic purchase-timing models such as the BG/NBD model from Fader, Hardie and Lee, which predicts future purchasing from each customer's past transaction history.
Common mistakes
- Averaging across categories. A blended interval for a catalogue mixing consumables and durables describes no real customer. Split by product or category first.
- Ignoring one-time buyers. The metric only covers customers who returned. If most of your customers never place a second order, a tidy 35-day interval hides the bigger problem. Always report it next to your repeat purchase rate.
- Counting subscription renewals. Auto-renewing orders measure a billing schedule, not a choice. Exclude them or analyse them separately.
How it connects to the rest of the lifecycle program
Time between purchases is a timing input, not a goal. Shortening it through bundles, larger pack sizes or a well-timed reminder raises purchase frequency, which flows directly into customer LTV. It also anchors the recency thresholds in your segmentation and the delays in almost every post-purchase flow. The best Klaviyo flows for DTC brands covers how those flows fit together, and churn prevention covers what to do once a customer starts slipping past their cycle.
The bottom line
Measure the median days between consecutive orders, split it by category and by first versus later orders, and read it next to your repeat rate. Then set every replenishment, nudge, win-back and lapsed threshold from that number, not a round figure.
Sources
Frequently Asked Questions
What is a good time between purchases for an ecommerce brand?
There is no universal good number, because the interval depends on what you sell. A consumable with a 30-day supply should show an interval near 30 days, while apparel or home goods can run several months. The useful comparison is against your own history and your own product logic: is the interval shrinking or stretching over time, and does it match how fast customers use the product? Track it by category rather than chasing an industry average.
How do I calculate average days between orders in Shopify or a spreadsheet?
Export orders with customer ID and order date, sort by customer then date, and subtract each order date from the previous order date for the same customer. That gives one row per interval. Drop each customer's first order, since it has no prior order, then take the median of the remaining intervals. Add a column for product category if your catalogue mixes consumables and durables, and summarise each category separately.
Should I use median or average time between purchases?
Use the median for scheduling. Purchase gaps are skewed by customers who come back after many months, and those outliers pull the average later than most customers actually reorder. A reminder timed on an inflated average lands after the typical customer has already bought again or gone to a competitor. Keep the average for reference if you like, but look at the median and the 25th to 75th percentile range together.
How does Klaviyo predict a customer's next order date?
Klaviyo's predictive analytics combines an individual's own order pattern with patterns across your whole customer base, using a model it retrains at least weekly. For someone with a single order it falls back on store-wide behaviour. The feature needs at least 500 ordering customers, 180 days of history with recent orders, and some customers with three or more orders before predictions appear on profiles.
When should a customer be considered lapsed?
Define lapsed relative to your own purchase cycle rather than a fixed number of days. A common approach is to treat a customer as lapsed once they have gone roughly two median intervals without ordering, calculated for the category they buy from. A 60-day silence means churn risk for a product bought monthly, but is entirely normal for a product bought twice a year.


-thumbnail.webp)