Summarize this documentation using AI
Key Takeaways
- SMS repeats the email pattern, harder. Across 183,000+ Klaviyo accounts, SMS flows are 7.6% of sends and produce 45.2% of SMS revenue.
- SMS flows average click rates near 10%, roughly double campaigns, with top performers above 16% and top-decile revenue per recipient above $5.
- Median revenue per message across 17,000+ Shopify stores is $0.98, but the 90th percentile is $4.54. The spread inside the benchmark matters more than the median.
- Abandoned cart messages run 9.53% to 17.28% click rate and $3.52 to $10.95 per message. Back in stock runs higher still, at 36.71% to 58.70% click.
- Campaign blasting decays fast: BFCM campaign revenue per message fell from $0.31 to $0.14 across ten days while click rate held roughly flat.
SMS benchmarks circulate in worse shape than email benchmarks, which is saying something. Most published numbers have no sample size, no date and no definition of what counts as a send.
This piece uses two sources that disclose all three, and it separates them rather than blending them, because they measure different populations.
The two datasets worth using
Klaviyo's 2026 SMS benchmarks are drawn from more than 183,000 customers and compare automated flows against broadcast campaigns on the same accounts, which controls for brand and category (Klaviyo).
Postscript's 2026 benchmarks cover more than 17,000 Shopify stores over 1 January to 15 December 2025, restricted to stores installed at least 90 days before Black Friday and spending a minimum in Q3 (Postscript). Their figures are reported as percentile ranges, which is far more useful than an average.
Neither is the market. Both are a platform's own customer base. Use them as orientation, then measure your own.
Finding 1: the flow versus campaign gap is wider in SMS than in email
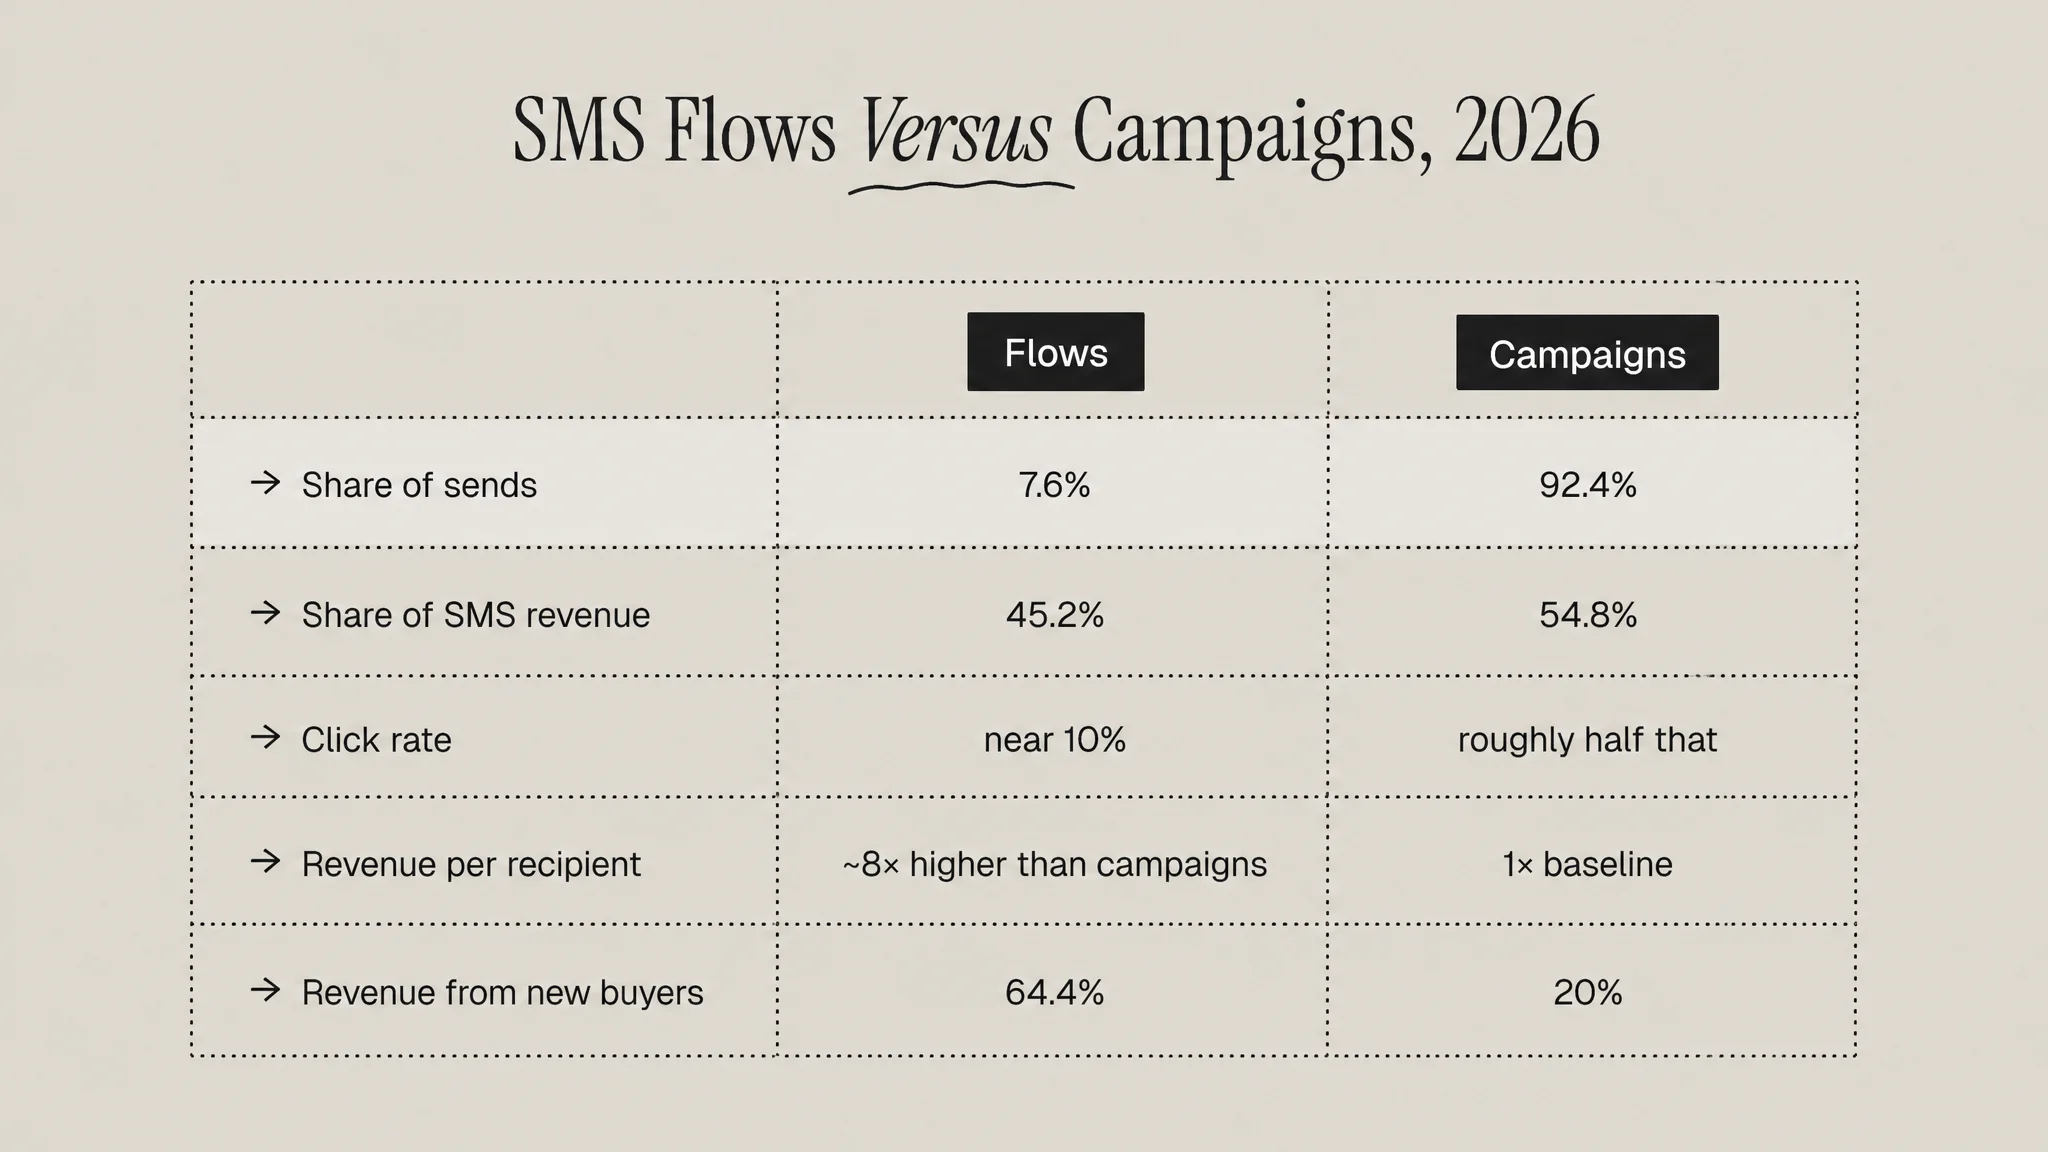
Klaviyo's headline comparison is stark. SMS flows account for just 7.6% of sends yet drive 45.2% of total SMS revenue. Flows average click rates approaching 10%, almost double campaign performance, and top performers exceed 16%. Revenue per recipient from flows runs roughly 8 times higher than campaigns, and the top 10% of SMS flows achieve revenue per recipient above $5.
Set that beside the email equivalent from the same provider: flows are 5.3% of email sends and nearly 41% of email revenue. The shape is identical and the SMS version is slightly more extreme.
There is also an acquisition finding hiding in there. Nearly two thirds of SMS flow revenue, 64.4%, comes from new buyers, against just 20% for campaigns. SMS automation is doing more first-purchase work than most brands credit it with, which mirrors what we found for email in lifecycle marketing automation ROI in 2026.
Finding 2: the percentile spread is the real benchmark
Postscript reports revenue per message at $0.41 at the 25th percentile, $0.98 at the median, $2.13 at the 75th and $4.54 at the 90th. That is an eleven-fold spread between the bottom quartile and the top decile within the same platform, same period, same store type.
Subscriber lifetime value shows the same shape: $25.04 at the 25th percentile, $71.20 median, $205.14 at the 75th, $553.02 at the 90th.
Anyone quoting "average SMS revenue per message" as a target is quoting a number that describes almost nobody. The useful question is which percentile you are in and what the band above you is doing differently.
Subscriber retention is the quiet metric
Postscript's median subscriber retention rate is 93.13%, with the 25th percentile at 86.35% and the 90th at 99.08%. On a list of any size, the gap between 86% and 99% retention compounds into a completely different asset within a year. List health is a retention problem, not an acquisition problem, and it is measured in exactly the same way as customer retention. The retention curve applies here too.
Finding 3: message type predicts performance more than industry does
Postscript's breakdown by message type, given as 25th to 90th percentile ranges:
| Message type | Click rate | Conversion rate | Revenue per message |
|---|---|---|---|
| Back in stock | 36.71% to 58.70% | 7.18% to 13.80% | $5.92 to $13.34 |
| Abandoned cart | 9.53% to 17.28% | 3.97% to 7.84% | $3.52 to $10.95 |
| Campaign (BFCM average) | around 3.1% to 3.2% | not reported | $0.31 falling to $0.14 |
Back in stock outperforms everything because the intent is unambiguous and the message is a favour rather than an interruption. Abandoned cart is the workhorse. Broadcast campaigns sit an order of magnitude below both.
The unsubscribe figures matter alongside the revenue. Abandoned cart carries a 0.56% to 1.83% unsubscribe rate, which is a real cost on a channel where a lost subscriber is permanent and was expensive to acquire.
Finding 4: campaign sends decay within a promotional window
Across the ten days from 25 November to 4 December 2025, Postscript recorded average campaign revenue per message falling from $0.31 to $0.14 while click rate stayed roughly flat at 3.2% down to 3.1%.
Read that carefully, because it is the single most useful operational number in the set. Engagement barely moved. Revenue halved. People kept clicking and stopped buying, which is what saturation looks like: the same audience, repeatedly offered, progressively less willing to act.
The practical implication for peak season is that the fifth message of a promotional week is not worth what the first was, and the marginal cost is paid in list attrition you will still be carrying in March.
How to benchmark your own SMS programme
Split flow revenue from campaign revenue first
Everything above is invisible in a blended number. Twelve months, monthly, revenue and send volume for each. You are looking for your own version of 7.6% and 45.2%.
Measure revenue per message, not revenue
Total SMS revenue rewards sending more. Revenue per message is the only figure that tells you whether the channel is being used well, and it is the figure Postscript reports in percentiles you can place yourself against.
Track unsubscribe as a cost line
Put a value on a subscriber using the subscriber lifetime value band you sit in, then price each campaign's unsubscribes against its revenue. A number of promotional sends stop being profitable under that accounting.
Build the automation library before adding volume
If back in stock and browse abandonment are not live, those are the highest revenue per message assets in the benchmark and you do not have them. Start there rather than adding another weekly blast. Our guides to ecommerce SMS marketing strategies and integrating email and SMS cover the build, and personalized campaigns across email, SMS and push covers the orchestration.
The bottom line
The 2026 SMS data says what the email data says, only louder: a small fraction of automated, intent-triggered sends carries most of the revenue, and the broadcast calendar most teams spend their week on sits an order of magnitude below it.
Benchmark yourself on revenue per message against the percentile bands rather than against an average, treat unsubscribes as a real cost, and build the triggered library before you buy more volume. How to audit your lifecycle marketing program has the reconciliation, and the B2C retention benchmarks database covers the tests any benchmark should pass before you quote it.
Sources
- Klaviyo, 2026 SMS Marketing Benchmarks by Industry (183,000+ customers)
- Postscript, 2026 SMS Benchmarks for ecommerce marketing (17,000+ Shopify stores, 1 January to 15 December 2025)
- Klaviyo, 2026 Email Marketing Benchmarks by Industry
Frequently Asked Questions
What is a good SMS click rate for ecommerce in 2026?
It depends entirely on message type. Klaviyo reports automated SMS flows averaging click rates near 10 percent, with top performers above 16 percent, against campaigns at roughly half that. Postscript's data across 17,000 Shopify stores puts abandoned cart at 9.53 to 17.28 percent and back in stock at 36.71 to 58.70 percent, while broadcast campaigns during BFCM averaged around 3.1 to 3.2 percent. Compare yourself against your own message types, not a blended average.
How much revenue should SMS generate per message?
Postscript's 2026 benchmarks across more than 17,000 Shopify stores report revenue per message of $0.41 at the 25th percentile, $0.98 at the median, $2.13 at the 75th and $4.54 at the 90th. That is an elevenfold spread within the same platform and period, so an average is close to meaningless. Triggered messages sit far higher: abandoned cart runs $3.52 to $10.95 and back in stock $5.92 to $13.34.
Do SMS flows outperform SMS campaigns?
Substantially, and by a wider margin than in email. Klaviyo's analysis across more than 183,000 customers found SMS flows account for just 7.6 percent of sends yet drive 45.2 percent of total SMS revenue, with revenue per recipient roughly 8 times higher than campaigns. Nearly two thirds of SMS flow revenue, 64.4 percent, comes from new buyers against 20 percent for campaigns, so automation is doing acquisition work too.
What is a good SMS unsubscribe rate?
Postscript reports abandoned cart messages carrying a 0.56 to 1.83 percent unsubscribe rate. Because an SMS subscriber is expensive to acquire and permanently lost when they opt out, unsubscribes should be priced as a cost line rather than monitored as a hygiene metric. Use your subscriber lifetime value band, which runs from $25.04 at the 25th percentile to $553.02 at the 90th, to value each lost subscriber against the revenue a send produced.
How many SMS campaigns should you send during BFCM?
Fewer than most brands do. Postscript recorded average campaign revenue per message falling from $0.31 to $0.14 across the ten days from 25 November to 4 December 2025, while click rate stayed roughly flat at 3.2 down to 3.1 percent. Engagement barely moved while revenue more than halved, which is what audience saturation looks like. The marginal send is paid for in list attrition you will still be carrying months later.